
About TRAIT
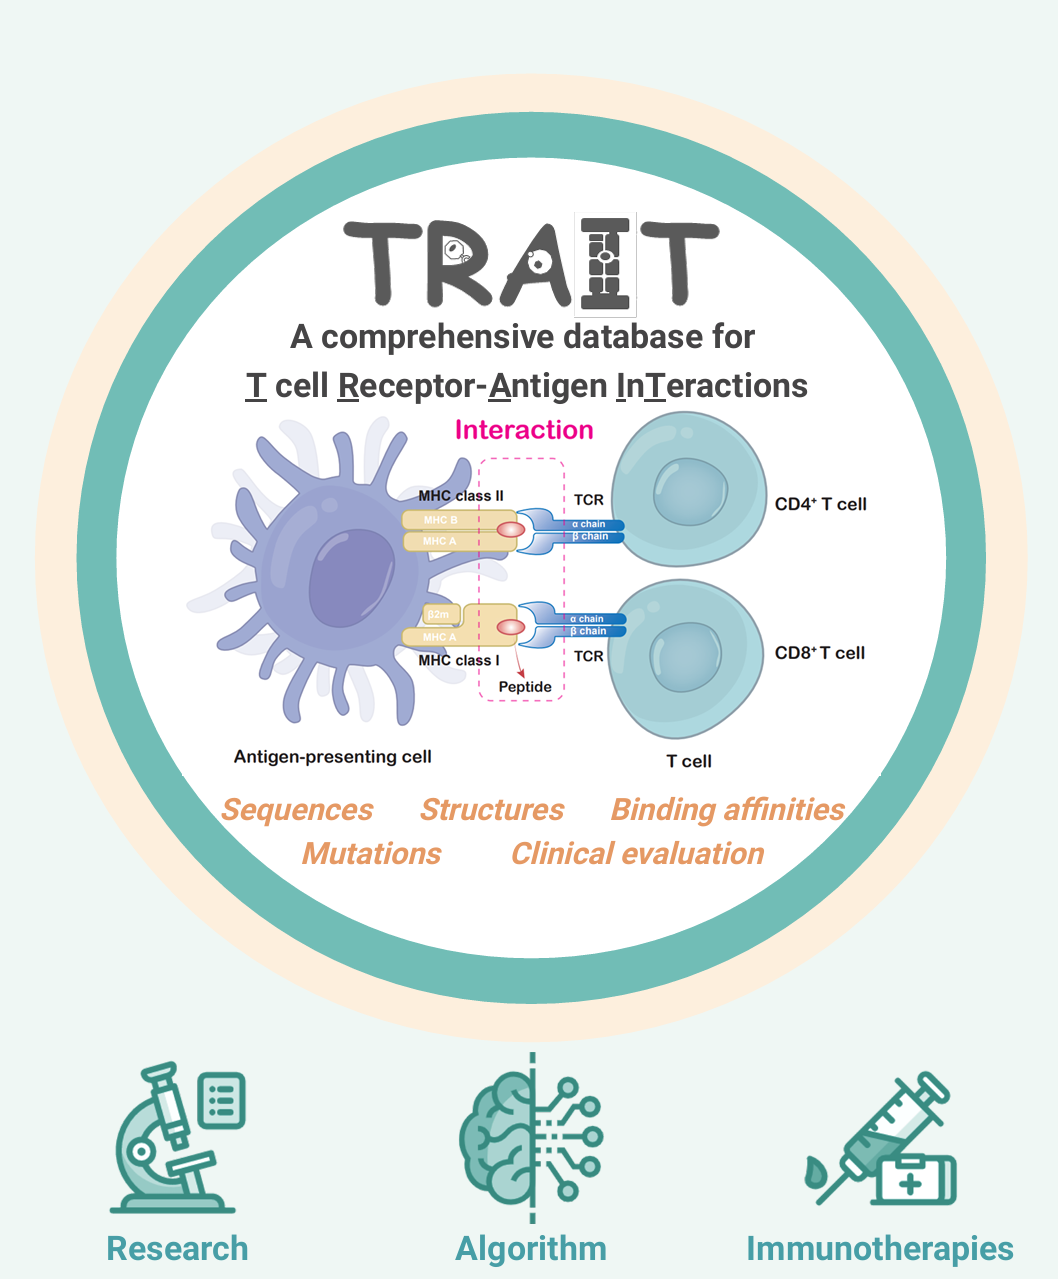
TRAIT provides a landscape of experimentally verified interactive and non-interactive TCR-antigen pairs, together with multi-dimensional perspectives of interaction features integrating sequences, structures, and affinities. TRAIT is dedicated to providing users with relevant data from “discovery, optimization, and clinical evaluations” TCRs, facilitating the development of T cell-based immunotherapies. The unique features of TRAIT include: i) comprehensive description of TCR-antigen interactions by integrating sequences, structures, and binding capacities. ii) Millions of reliable non-interactive TCR/antigen pairs were uniquely collected, allowing users to query features of amino acids that critical for interactions. iii) It thoroughly demonstrates the interactions between mutations of TCRs and antigens, thereby benefiting affinity maturation of engineered TCRs as well as vaccine design. iv) TCRs on clinical trials were innovatively provided.
Overview and Advantages

TCR-antigen Pairs
Antigen Records
Interactive Pairs
3,342,225
Non-interactive Pairs
Published Structures
Mutation Records
Publications
34
Clinical trails

Sequences Structures Affinities
- Comprehensive integration of sequences, structures and affinities;
- Multi-dimensional perspectives of interaction features;
- Landscape of experimentally verified TCR-antigen pairs;
- Unique platform for non-interactive TCR-antigen pairs.
Mutations & Evolution
- Systematic display of mutation-affinity data for TCR-antigen pairs;
- Useful platform for the affinity maturation of engineered TCRs;
- Conducive to De novo design of TCRs;
- Powerful source for immunotherapies and vaccine design.
Statistics
General Records
Record statistics by year
Line chart of unique TCR-antigen pairs, epitopes, MHC alleles and published structures cumulated by year. Data used for visualization are computed using interactive TCR-antigen pairs in the search page.
Summary of TCR records and V(D)J usage
TCR sequence length distrubution
Average V-J gene utilization of paired TCR sequences
Representative data for interactive pairs, only variable genes with at least 45 records(α chain)/60 records(β chain) are shown.
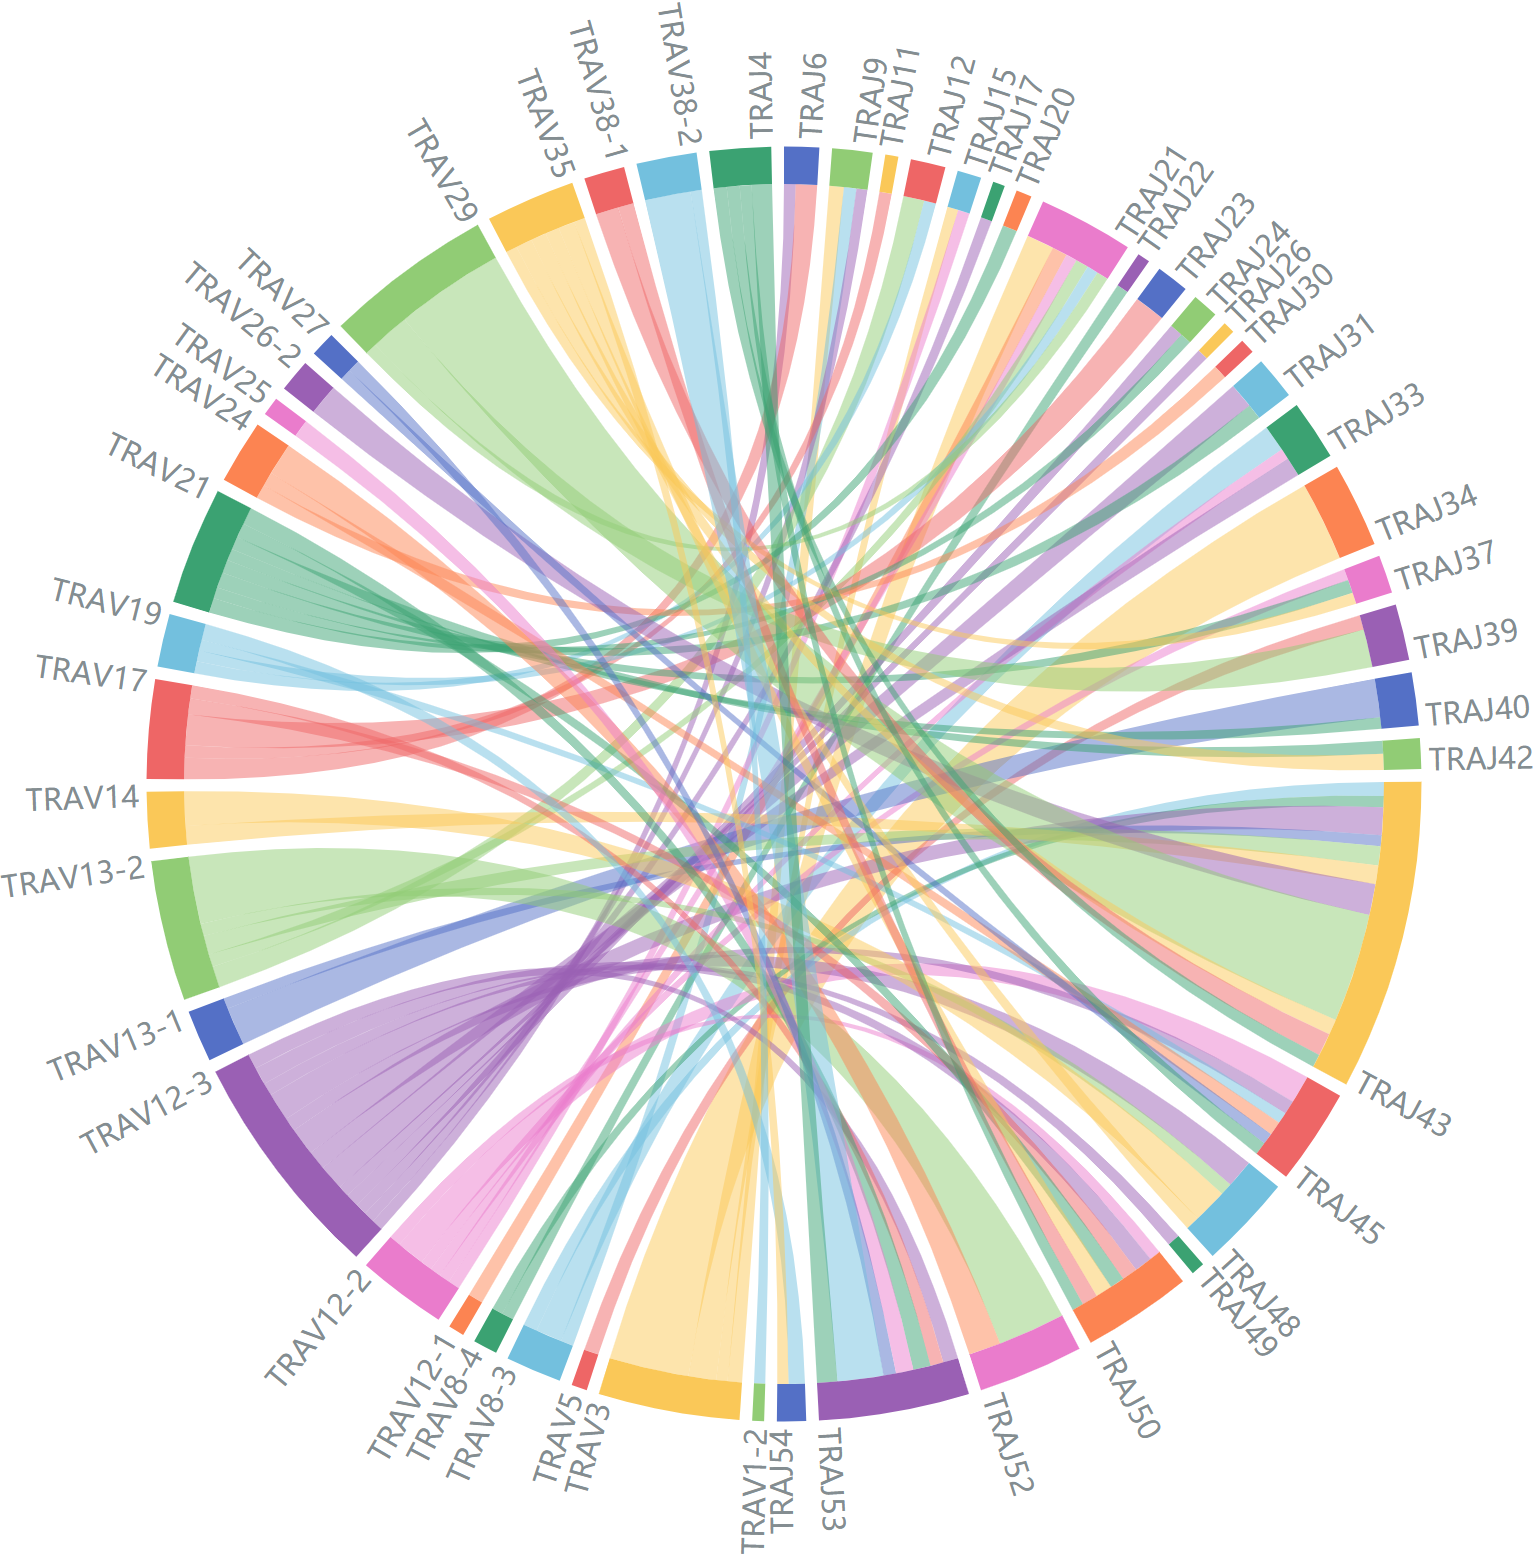
Average V-J gene utilization of α chain
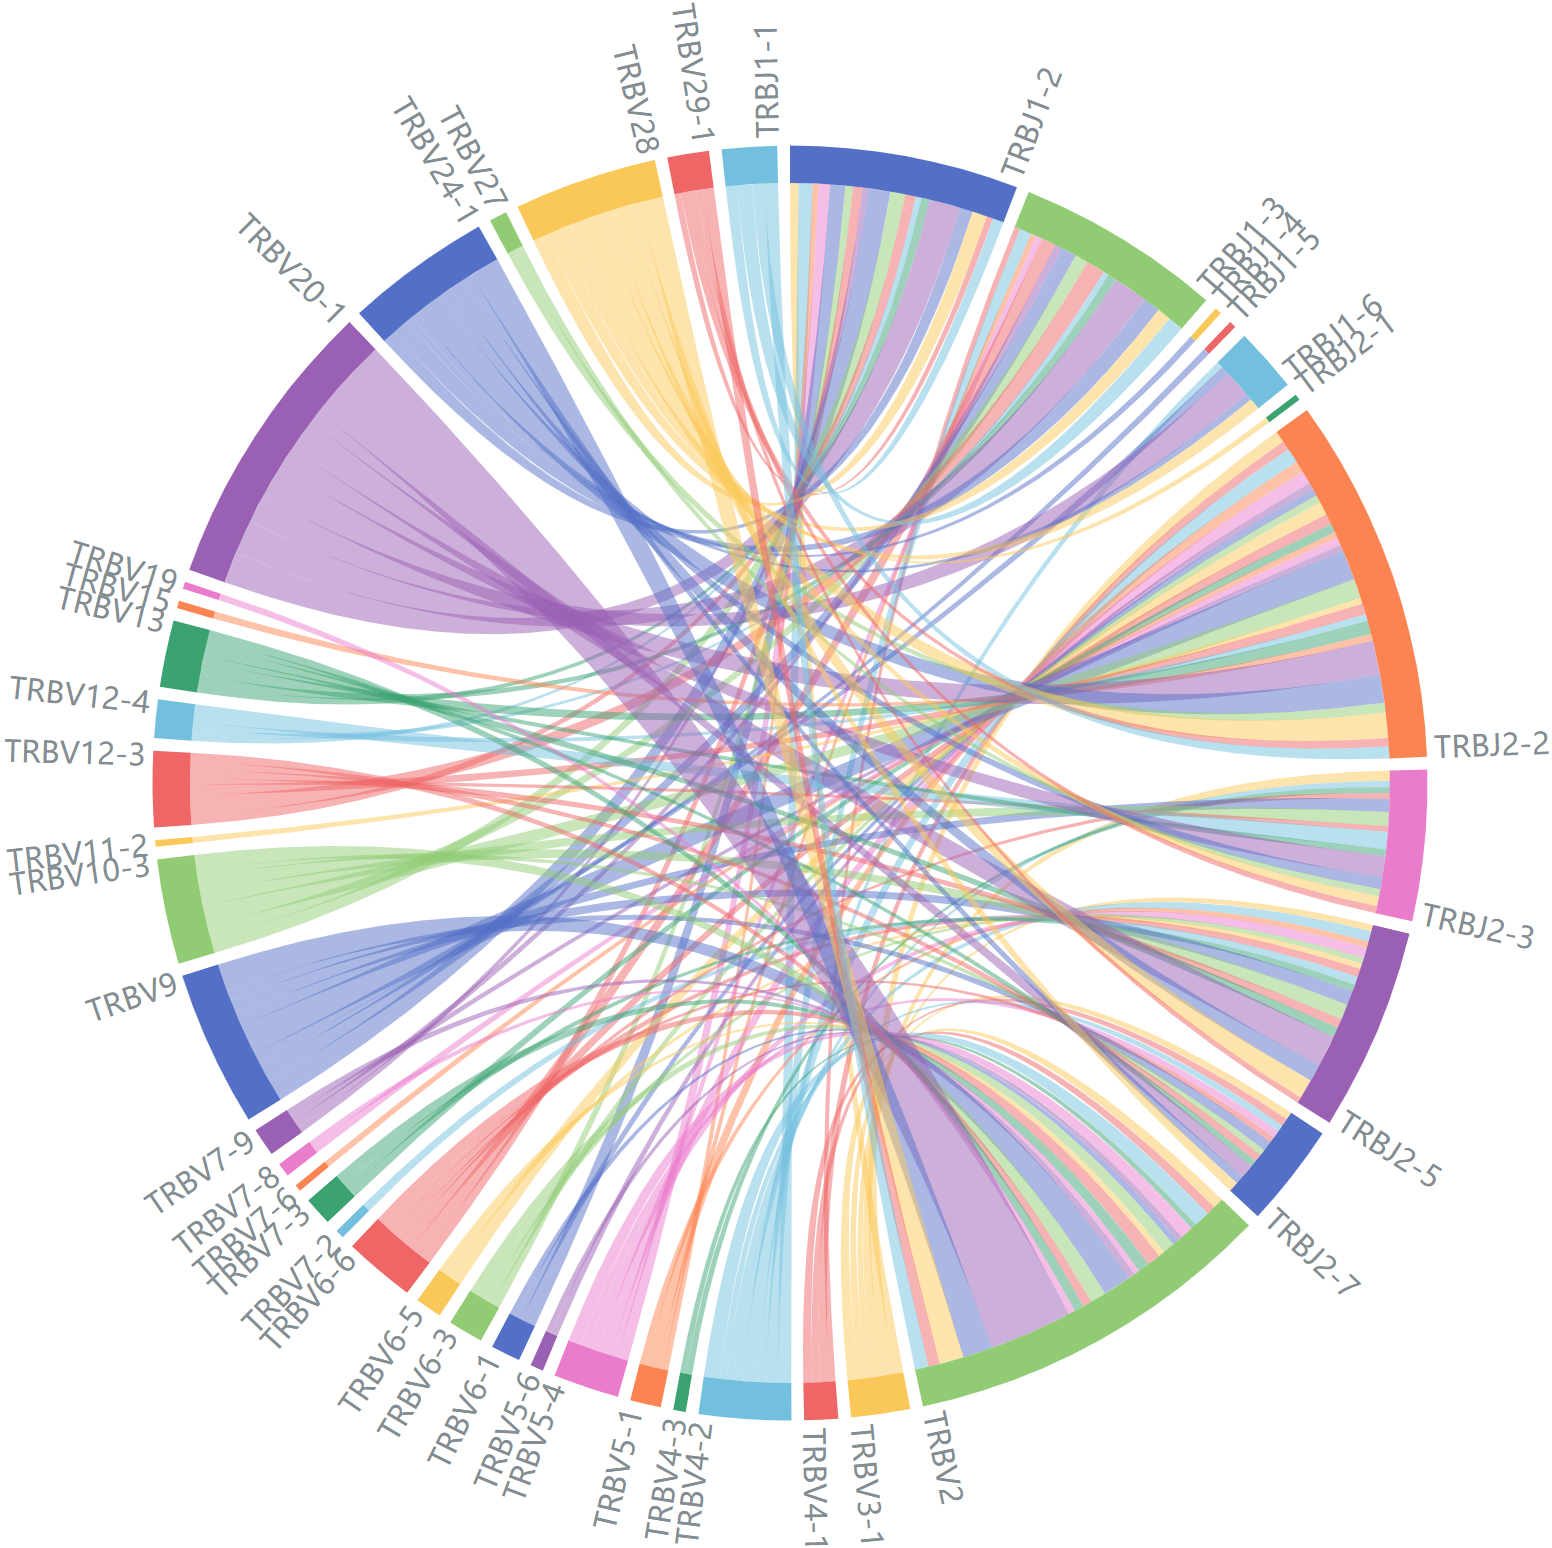
Average V-J gene utilization of β chain
Summary by antigens
Detailed summary data of epitopes.
| Epitope species | Unique Epitopes for paired TCRs | Unique Epitopes for un-paired TCRs | Interactive paired TCRs | Interactive unpaired TCRs | Non-interactive TCRs |
| Bacteroides Fragilis | 1 | 0 | 1 | 0 | 2 |
| CMV | 13 | 27 | 14490 | 7805 | 40476 |
| DENV1 | 1 | 1 | 4 | 162 | 168 |
| DENV2 | 0 | 1 | 0 | 60 | 61 |
| DENV3/4 | 1 | 1 | 4 | 155 | 161 |
| E.Coli | 2 | 0 | 2 | 0 | 4 |
| EBV | 27 | 13 | 4737 | 1493 | 35360 |
| Enterocloster Asparagiformis | 1 | 0 | 1 | 0 | 2 |
| HCoV-229E | 1 | 0 | 1 | 0 | 2 |
| HCoV-HKU1 | 3 | 1 | 26 | 9 | 39 |
| HCoV-NL63 | 1 | 0 | 1 | 0 | 2 |
| HCV | 13 | 6 | 760 | 351 | 1130 |
| HHV | 1 | 0 | 1 | 0 | 2 |
| HIV | 25 | 39 | 128 | 2528 | 2728 |
| Homo Sapiens | 182 | 48 | 940 | 2151 | 3333 |
| HPV | 1 | 0 | 12 | 0 | 13 |
| HPV-16 | 2 | 0 | 2 | 0 | 4 |
| HSV-2 | 1 | 1 | 47 | 4 | 53 |
| HTLV-1 | 7 | 1 | 46 | 132 | 200 |
| Influenza B | 3 | 3 | 150 | 110 | 387 |
| InfluenzaA | 10 | 17 | 2353 | 7509 | 19916 |
| M.tuberculosis | 11 | 1 | 29 | 4 | 45 |
| MCPyV | 2 | 0 | 6 | 0 | 8 |
| MERS | 3 | 0 | 4 | 0 | 7 |
| Mtb | 0 | 2 | 0 | 400 | 407 |
| OC43 | 1 | 0 | 1 | 0 | 2 |
| PAR1 | 1 | 0 | 2 | 0 | 3 |
| Pseudomonas Aeruginosa | 1 | 0 | 1 | 0 | 2 |
| Pseudomonas Fluorescens | 1 | 0 | 1 | 0 | 2 |
| Saccharomyces Cerevisiae | 1 | 0 | 1 | 0 | 2 |
| SARS-CoV-2 | 575 | 338 | 2699 | 1373 | 4985 |
| Selaginella Moellendorffii | 1 | 0 | 1 | 0 | 2 |
| synthetic | 26 | 0 | 30 | 0 | 56 |
| Triticum Aestivum | 9 | 1 | 13 | 21 | 44 |
| Trypanosoma cruzi | 0 | 1 | 0 | 238 | 287 |
| YFV | 1 | 1 | 247 | 179 | 428 |
| Total | 929 | 503 | 26741 | 24684 | 110323 |
Detailed summary data of MHC alleles (Records >50).
| MHC A | MHC B | MHC class | Interactive paired TCRs | Interactive unpaired TCRs | Total |
| H2-Kb | B2M | MHCI | 0 | 238 | 238 |
| HLA-A*01:01 | B2M | MHCI | 800 | 487 | 1287 |
| HLA-A*02 | B2M | MHCI | 166 | 12564 | 12730 |
| HLA-A*02:01 | B2M | MHCI | 5567 | 4968 | 10535 |
| HLA-A*02:01:48 | B2M | MHCI | 79 | 0 | 79 |
| HLA-A*03:01 | B2M | MHCI | 14281 | 76 | 14357 |
| HLA-A*08:01 | B2M | MHCI | 63 | 0 | 63 |
| HLA-A*11:01 | B2M | MHCI | 2375 | 417 | 2792 |
| HLA-A*24:02 | B2M | MHCI | 263 | 191 | 454 |
| HLA-A*68:01 | B2M | MHCI | 104 | 19 | 123 |
| HLA-B*07:02 | B2M | MHCI | 699 | 872 | 1571 |
| HLA-B*08 | B2M | MHCI | 22 | 286 | 308 |
| HLA-B*08:01 | B2M | MHCI | 1543 | 370 | 1913 |
| HLA-B*15:01 | B2M | MHCI | 101 | 1 | 102 |
| HLA-B*27 | B2M | MHCI | 0 | 383 | 383 |
| HLA-B*27:05 | B2M | MHCI | 4 | 295 | 299 |
| HLA-B*35:01 | B2M | MHCI | 22 | 149 | 171 |
| HLA-B*42:01 | B2M | MHCI | 1 | 317 | 318 |
| HLA-B*44 | B2M | MHCI | 0 | 155 | 155 |
| HLA-B*44:03:08 | B2M | MHCI | 0 | 98 | 98 |
| HLA-B*57 | B2M | MHCI | 0 | 226 | 226 |
| HLA-B*57:01 | B2M | MHCI | 166 | 261 | 427 |
| HLA-DRA*01 | HLA-DRB1*01 | MHCII | 0 | 653 | 653 |
| HLA-DRA*01:01 | HLA-DRB1*04:01 | MHCII | 77 | 121 | 198 |
| HLA-DRA*01:01 | HLA-DRB1*11:01 | MHCII | 2 | 107 | 109 |
| HLA-DRA*01:01 | HLA-DRB1*15:01 | MHCII | 0 | 81 | 81 |
| HLA-DRA*01:01 | HLA-DRB5*01:01 | MHCII | 2 | 135 | 137 |
| HLA-DRA1*01 | HLA-DRB1*15 | MHCII | 0 | 303 | 303 |
| HLA-E*01:03 | B2M | MHCI | 5 | 400 | 405 |
Correspondence between TCRs and antigens
Zoom-in for correspondence between epitope genes, epitope, MHC and TCR chains (links supported by more than 100 records).
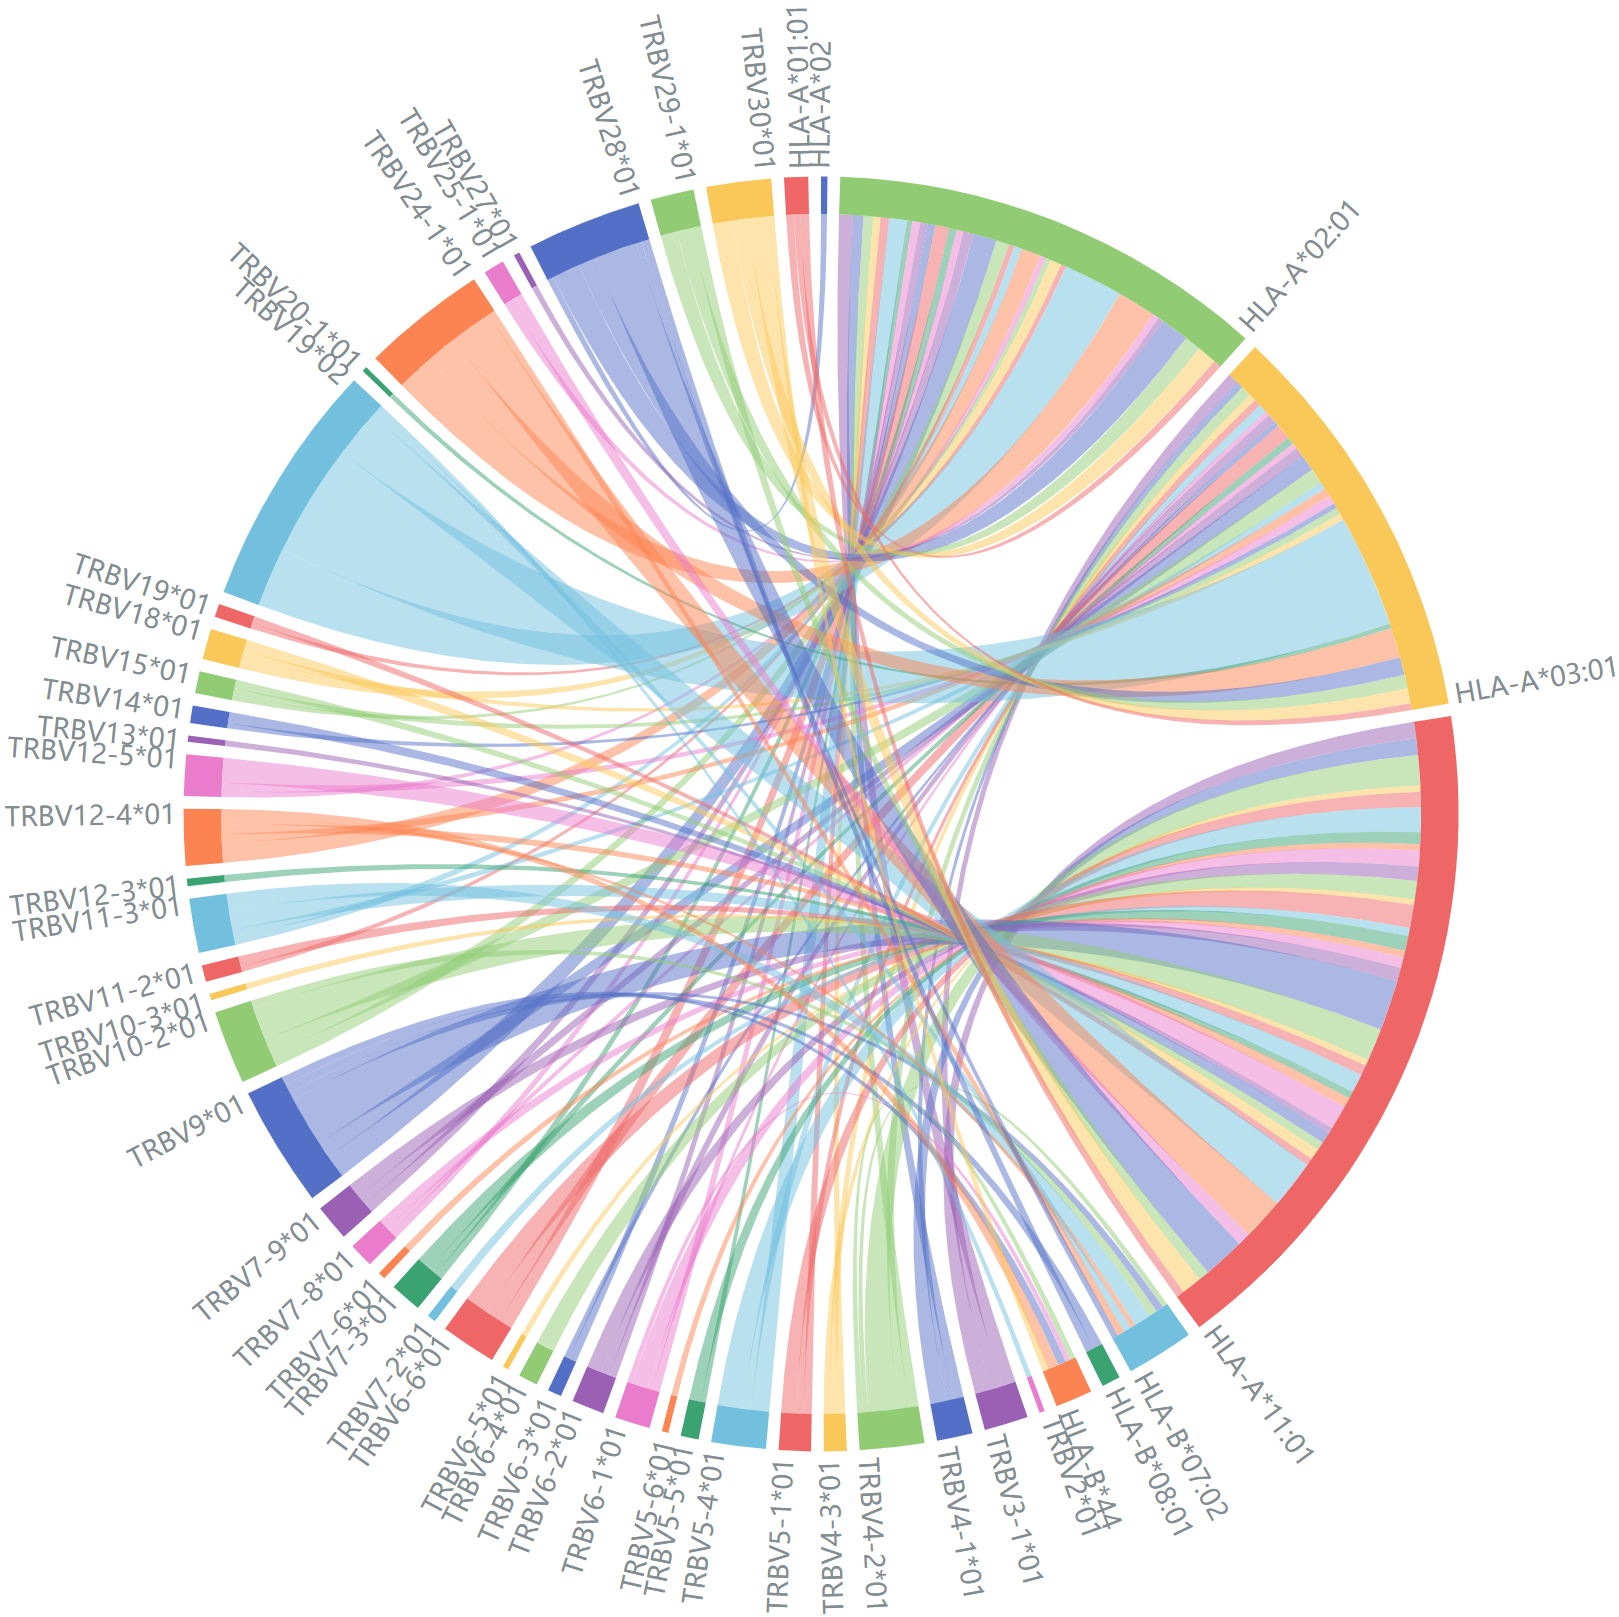
Correspondence between TRBV genes and MHC class I alleles.
Gene
HLA
Epitope
TCR Chain
Alluvium plot of epitopes grouped by Gene, HLA and TCR.