1.1. How to search epitope information of SARS-CoV-2 and other HCoVs in CovEpiAb?
In the page of "Human Coronavirus Epitope Search", users can find T-cell or B-cell epitope entries by searching epitope type, source virus, source antigen, HLA allele, and so on among the entire textual component of CovEpiAb. Query can be submitted by entering keywords into the main searching frame. Users also can input peptides to retrieve all similar epitopes by BLAST or enter protein sequences to screen epitope fragments. The resulting webpage displays profiles of all the epitopes directly related to the search term.
About the "Subclass" term
Identification of positive epitopes relies on experimental methods to assess reactivity between T/B-cells and candidate epitope peptides. The T/B cell response measured is from humans. Samples are obtained from healthy, vaccinated, infected, or environmentally exposed individuals with no evidence of disease. For T-cell epitopes, in vitro stimulation may be used to reactivate responsive T cells. In vivo and in vitro stimulatory immunogens include viral organisms, proteins, and peptides
Undetermined Epitopes: Epitopes identified from samples without immunogen stimulation.
Enviro-Exposed Epitopes: Epitopes identified from environmentally exposed individuals without disease.
Cross-Viral Homologous Epitopes: Epitopes exhibiting cross-reactivity in different viral species, with similar sequences and positions.
Cross-Viral Heterologous Epitopes: Epitopes exhibiting cross-reactivity in different viral species, with distinctly different sequences and positions.
Cross-Variant Homologous Epitopes: Epitopes exhibiting cross-reactivity within the same virus species and its variants, with similar sequences and positions.
Cross-Variant Heterologous Epitopes: Epitopes exhibiting cross-reactivity within the same virus species and its variants, with different sequences and positions.
For example, if you want to know all the epitopes and detail information of SARS-CoV-2 Spike glycoprotein, you can select "SARS-CoV-2" in the "Source organism" and "Spike glycoprotein" in the "Source antigen" field.
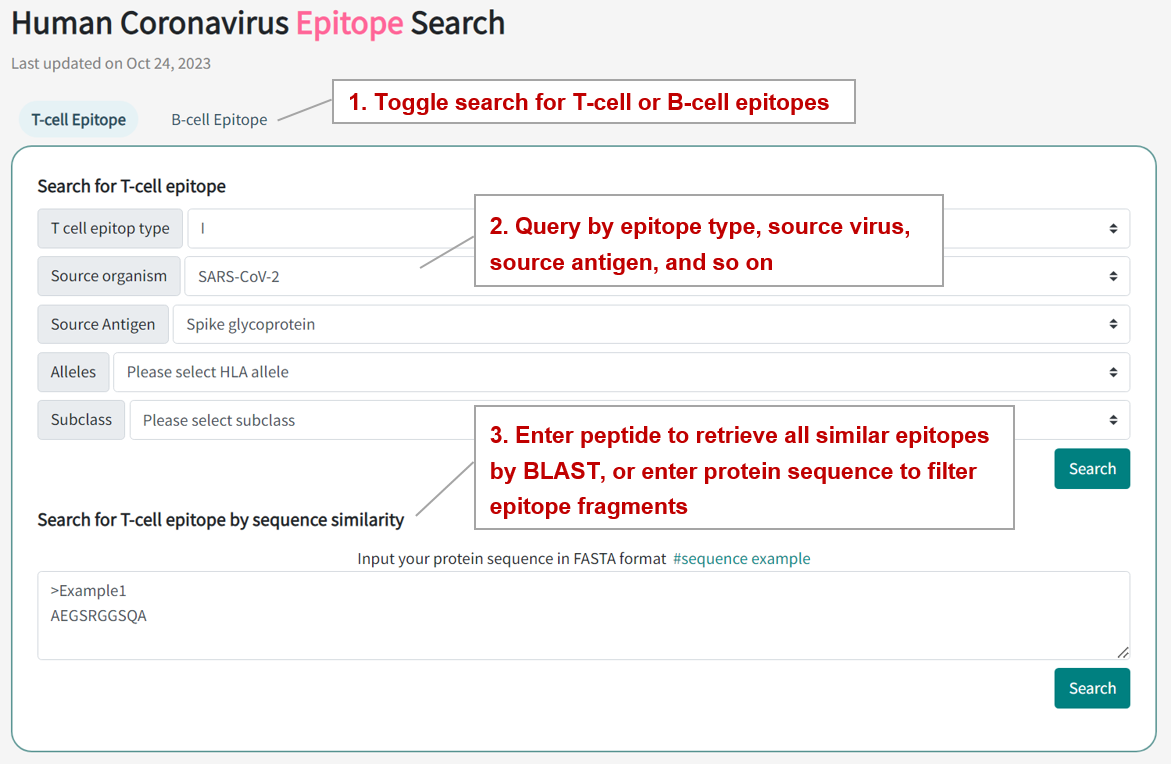
Search result of the "SARS-CoV-2" and "Spike glycoprotein" includes 464 epitope entries , with table shows the information of peptide, object type, subclass, position, source organism, soruce antigen, alleles, number of experimental assays, and number of receptors. The epitope ID button links to the detailed epitope information page.

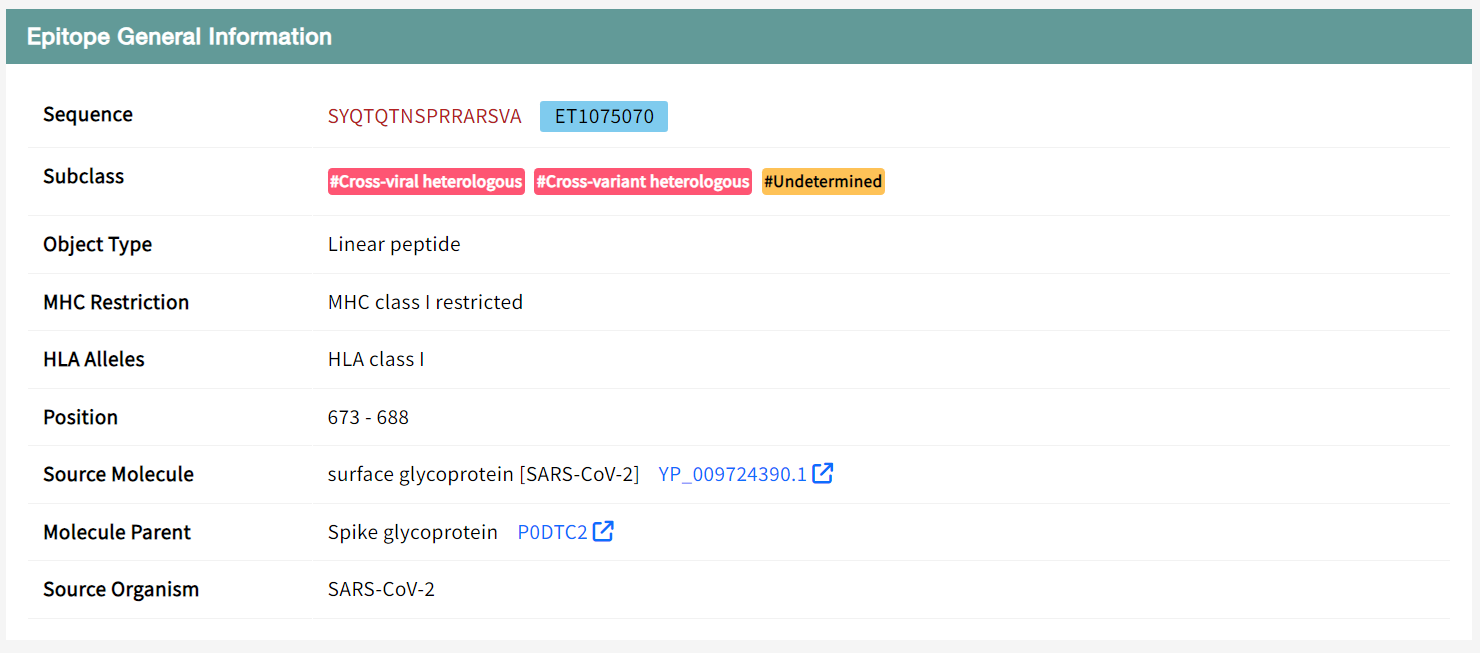
1.2. By clicking the epitope ID button, the detailed information page for epitope will be displayed.
Take the "ET1075070" epitope as an example, "Epitope General Information" section displays the general information of the MHC class I T-cell epitope SYQTQTNSPRRARSVA(ET1075070) including its ID, Sequence, Brand Name, Object Type, MHC Restriction, HLA Alleles, Position, Source Molecule, Molecule Parent, Source Organism, UniProt ID, taxonomy ID.
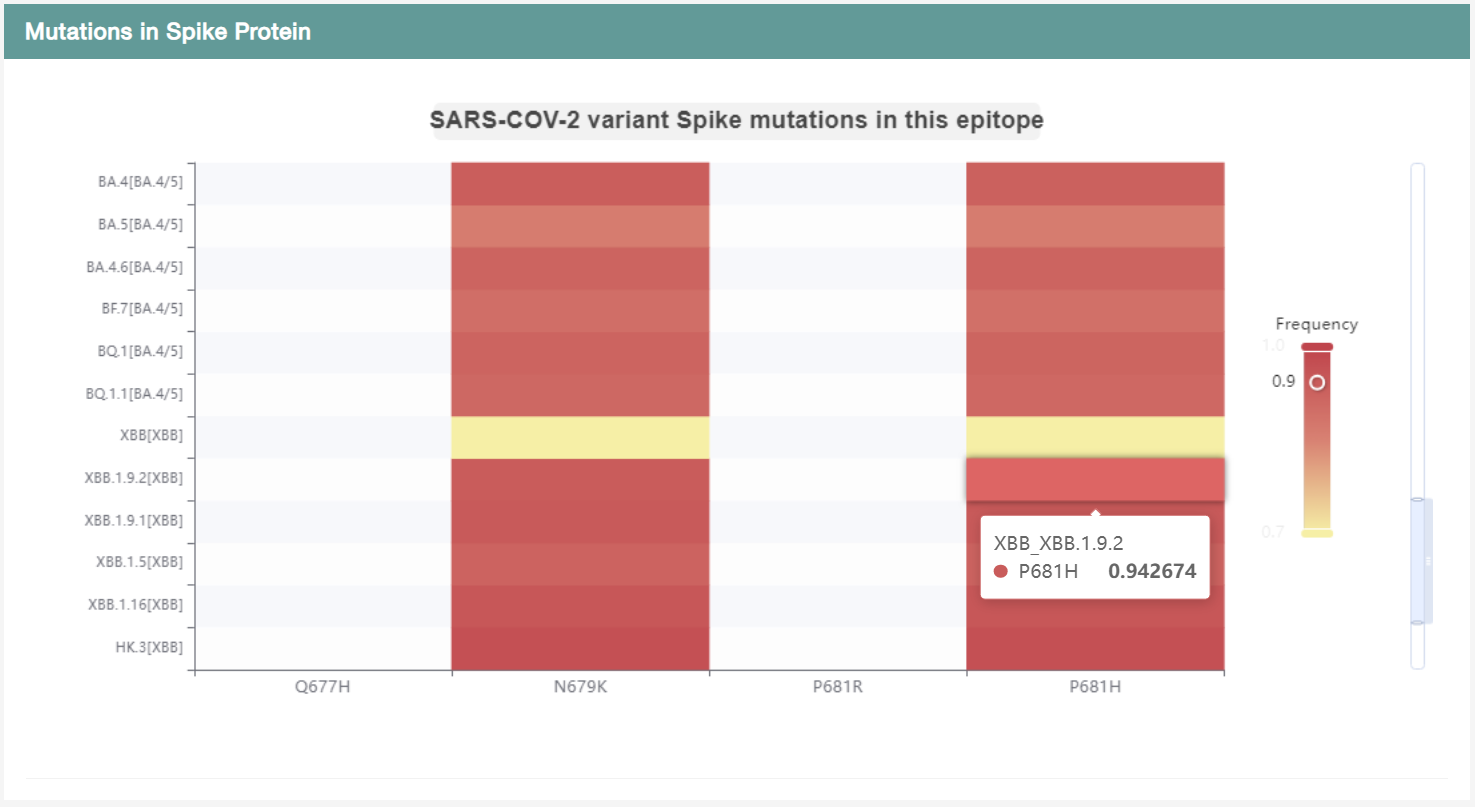
Users can explore the frequent mutations that occur in the SARS-CoV-2 S protein, which may lead to antigenic drift, transfer, and evasion of immune responses. We examined of mutation sites within the epitope, comparing variations among different variants. A heatmap was constructed, where the horizontal axis represents mutations, the vertical axis represents variants, and the value and color intensity indicate the frequency of mutations. Users can browser the heatmap to compare the mutation frequency of each site in the epitope across SARS-CoV-2 variants.
Conserved sites during coronavirus evolution are ideal targets for the development of broad-spectrum anti-SARS-CoV-2 drugs. We calculated the conservation scores of sites and epitopes in the homologous proteins of HCoVs and visualized the sequence alignment. Users can browser and download the alignment results in the conservation section.
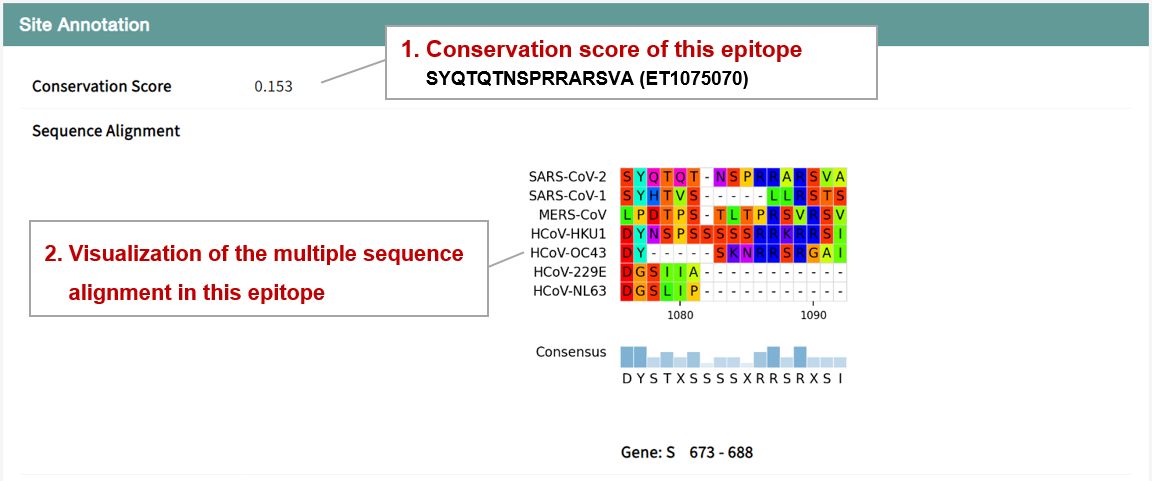
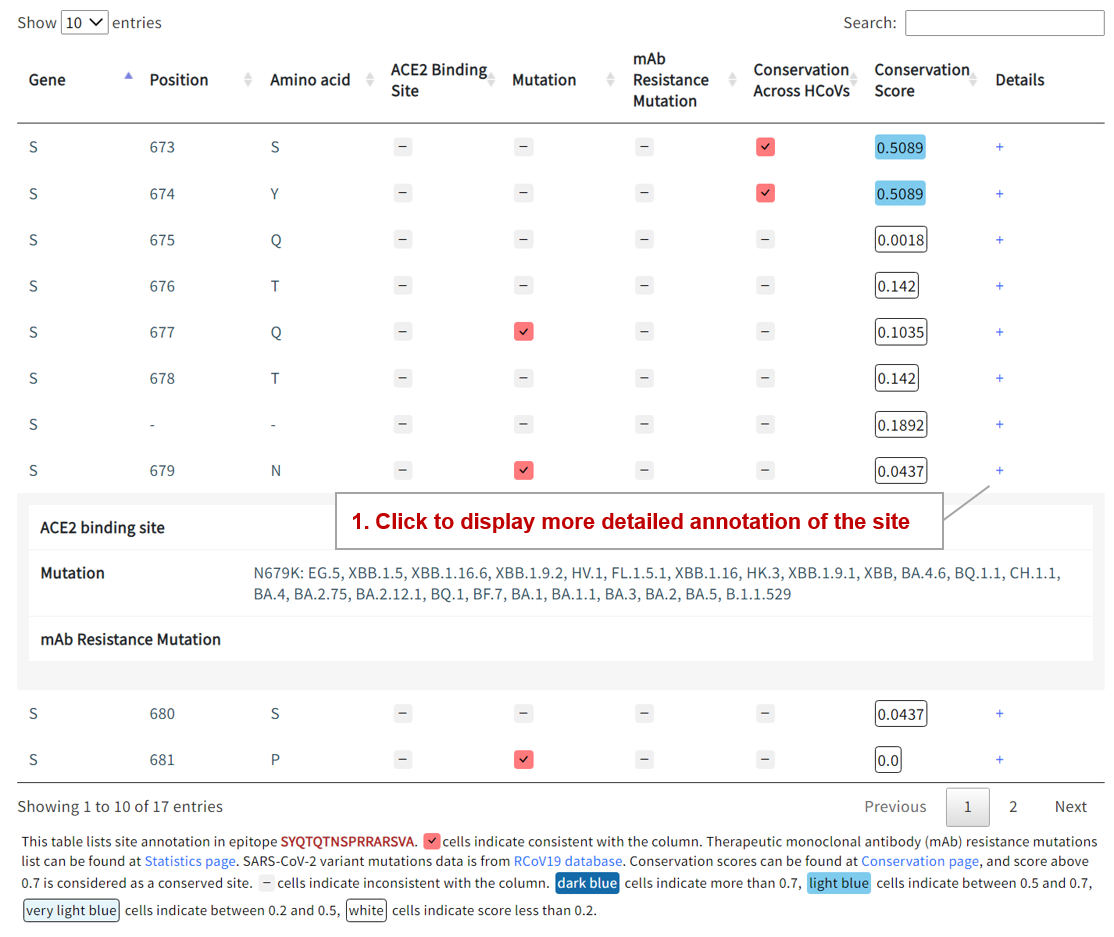
The functional site annotation is displayed in the table, including mutations, receptor binding sites, mAb resistance sites, and conserved sites. Users can click on the ‘+’ for more detailed annotation of each site.
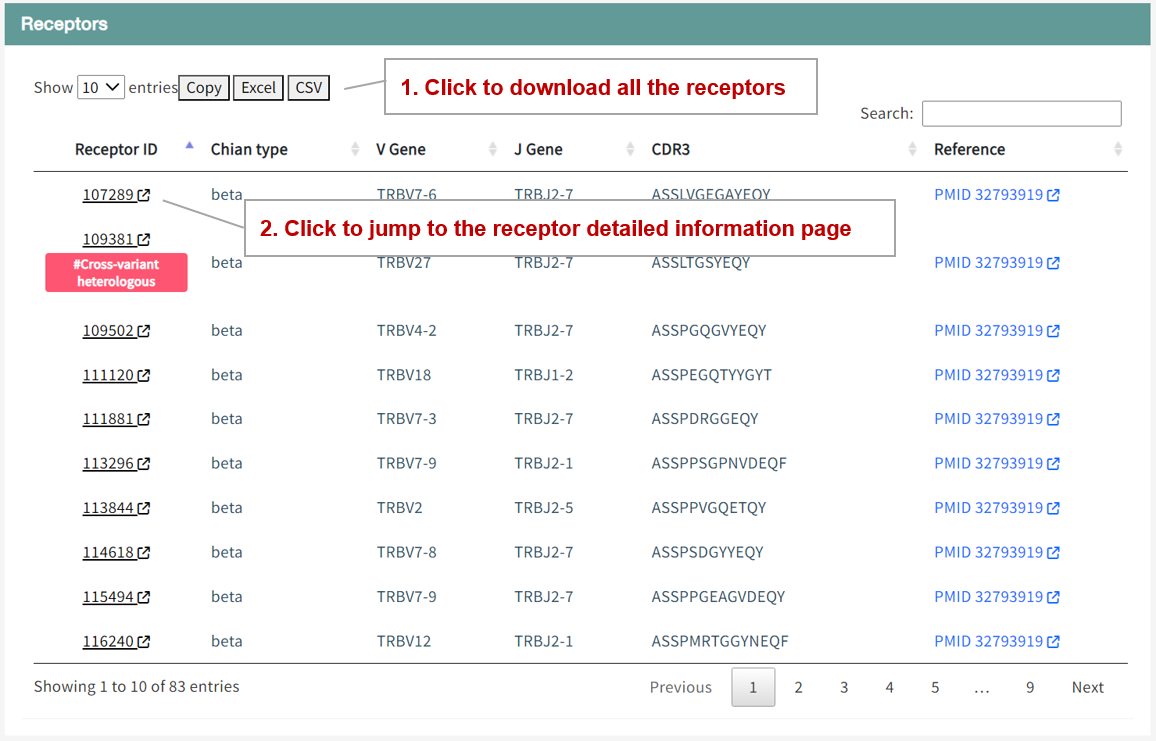
The table lists all the receptors bound by this epitope, including their genes and sequences. Users can click on the receptor ID to jump to the details page of this receptor, which includes all the epitopes bound to this receptor and related experimental analyses.
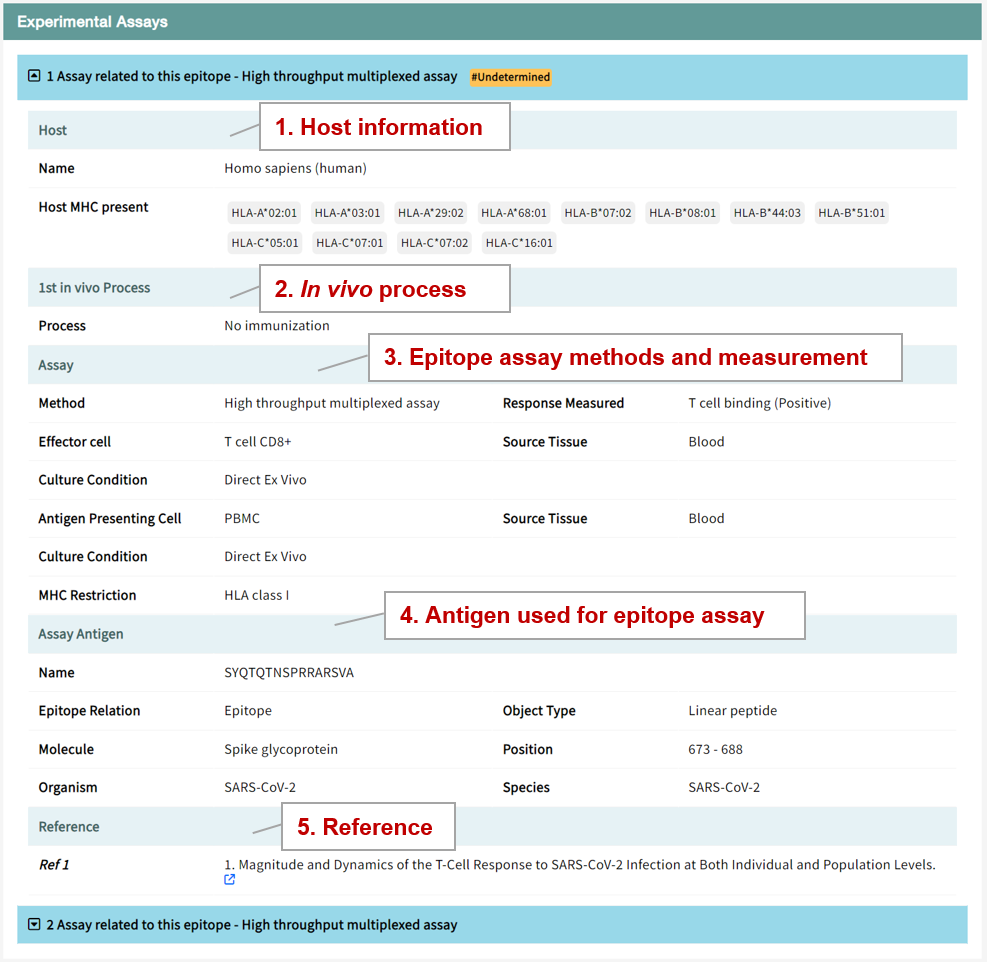
Users can view detailed entries for experimental assays describing protocols for immunostimulation procedures and experimental methods. We labeled these receptors and experimental methods according to the "Subclass" field of the epitope. All experimental methods are accompanied by references for further exploration by researchers.
2.1. How to search epitope information of SARS-CoV-2 and other HCovs in CovEpiAb?
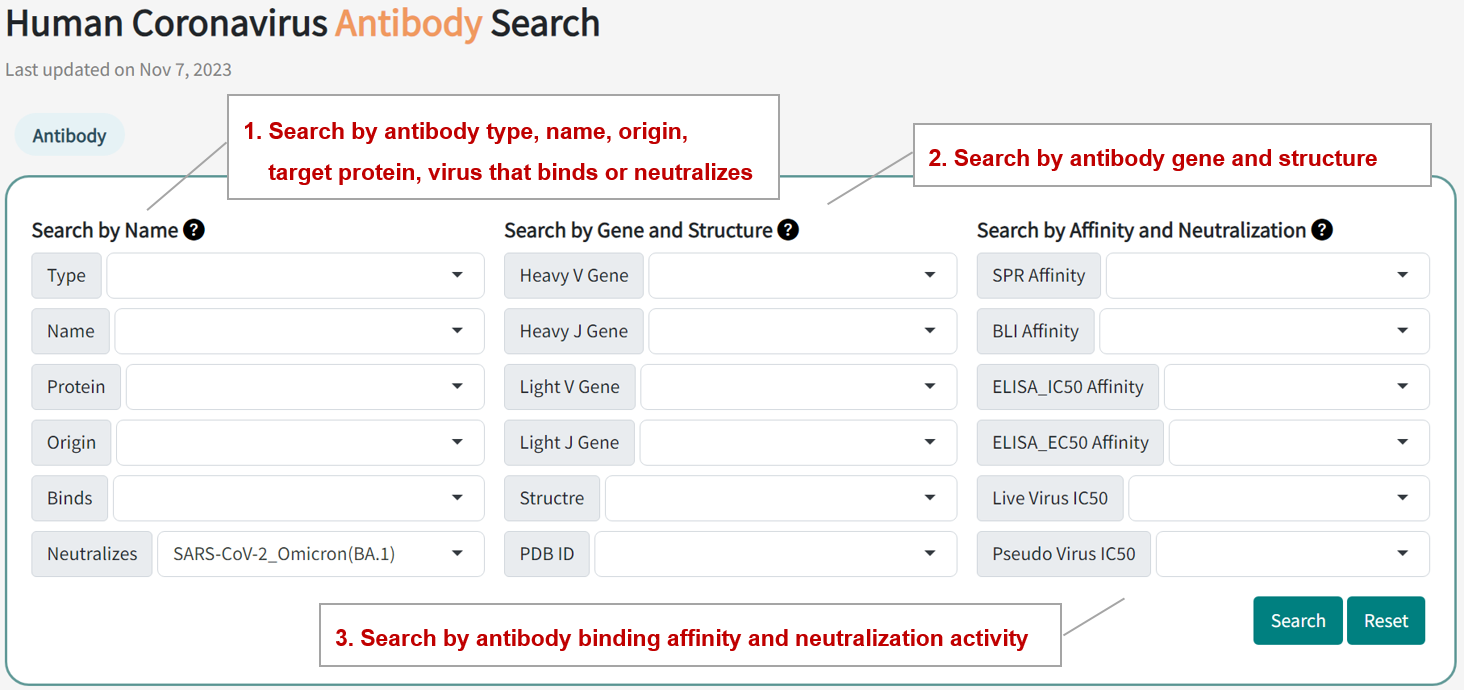
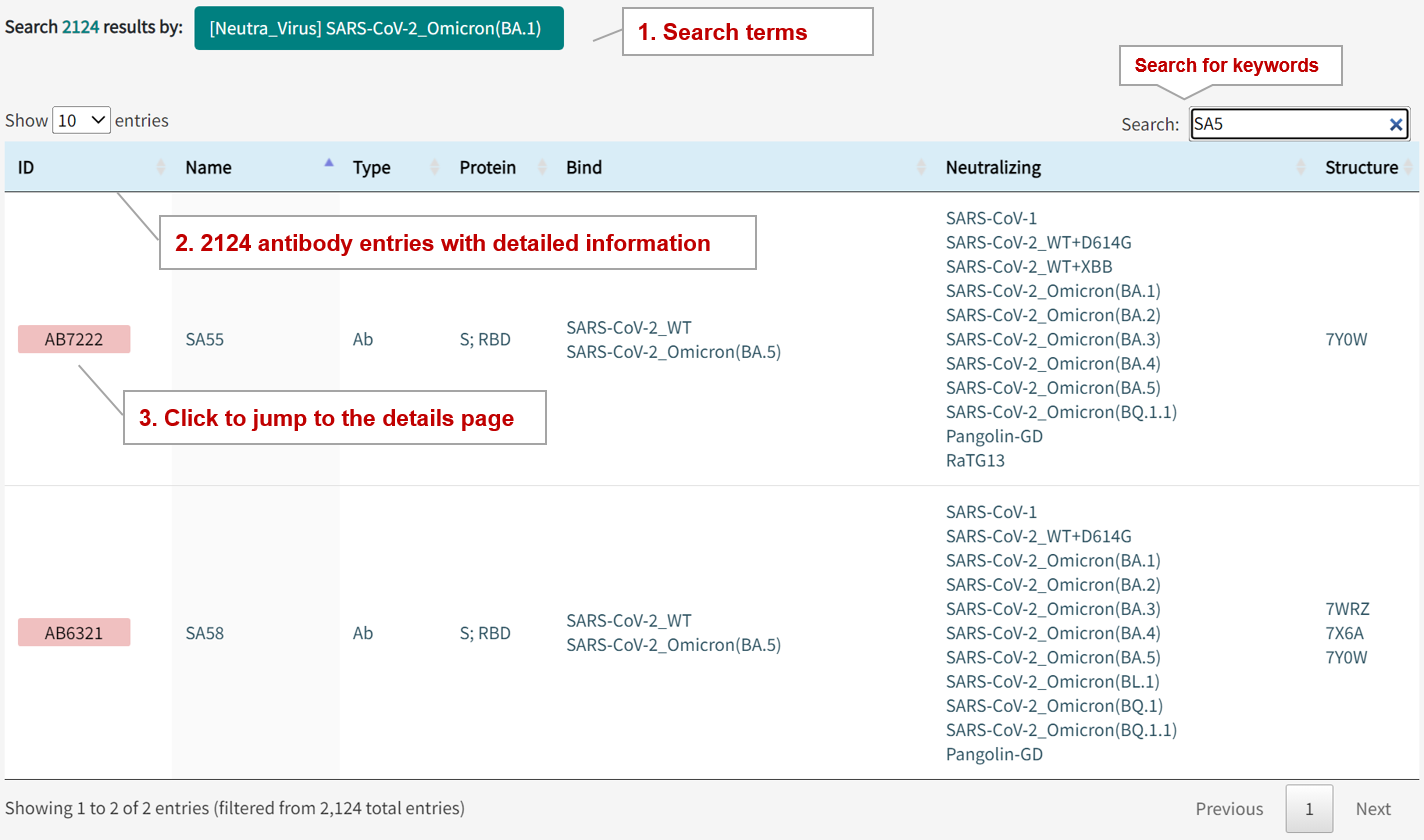
In the page of "Human Antibody Epitope Search", users can find antibody entries by searching three modules, including antibody type, name, origin, target protein, gene, structure, the virus binds or neitralizes, binding affinity, and neutralizing activity. Query can be submitted by entering keywords into the main searching frame. The resulting webpage displays profiles of all the antibodies directly related to the search term.
For example, if you want to know all the antibodies and detail information that neutralize SARS-CoV-2 Omicron BA.1 varaints, you can select "SARS-CoV-2_Omicorn(BA.1)" in the "Neutralizes" field.
Search result of the "SARS-CoV-2_Omicorn(BA.1)" in the "Binds" field includes 2124 epitope entries , with table shows the information of antibody name, type, targrt protein, binding virus, neutralizing virus, and structures. The antibody ID button links to the detailed antibody information page.
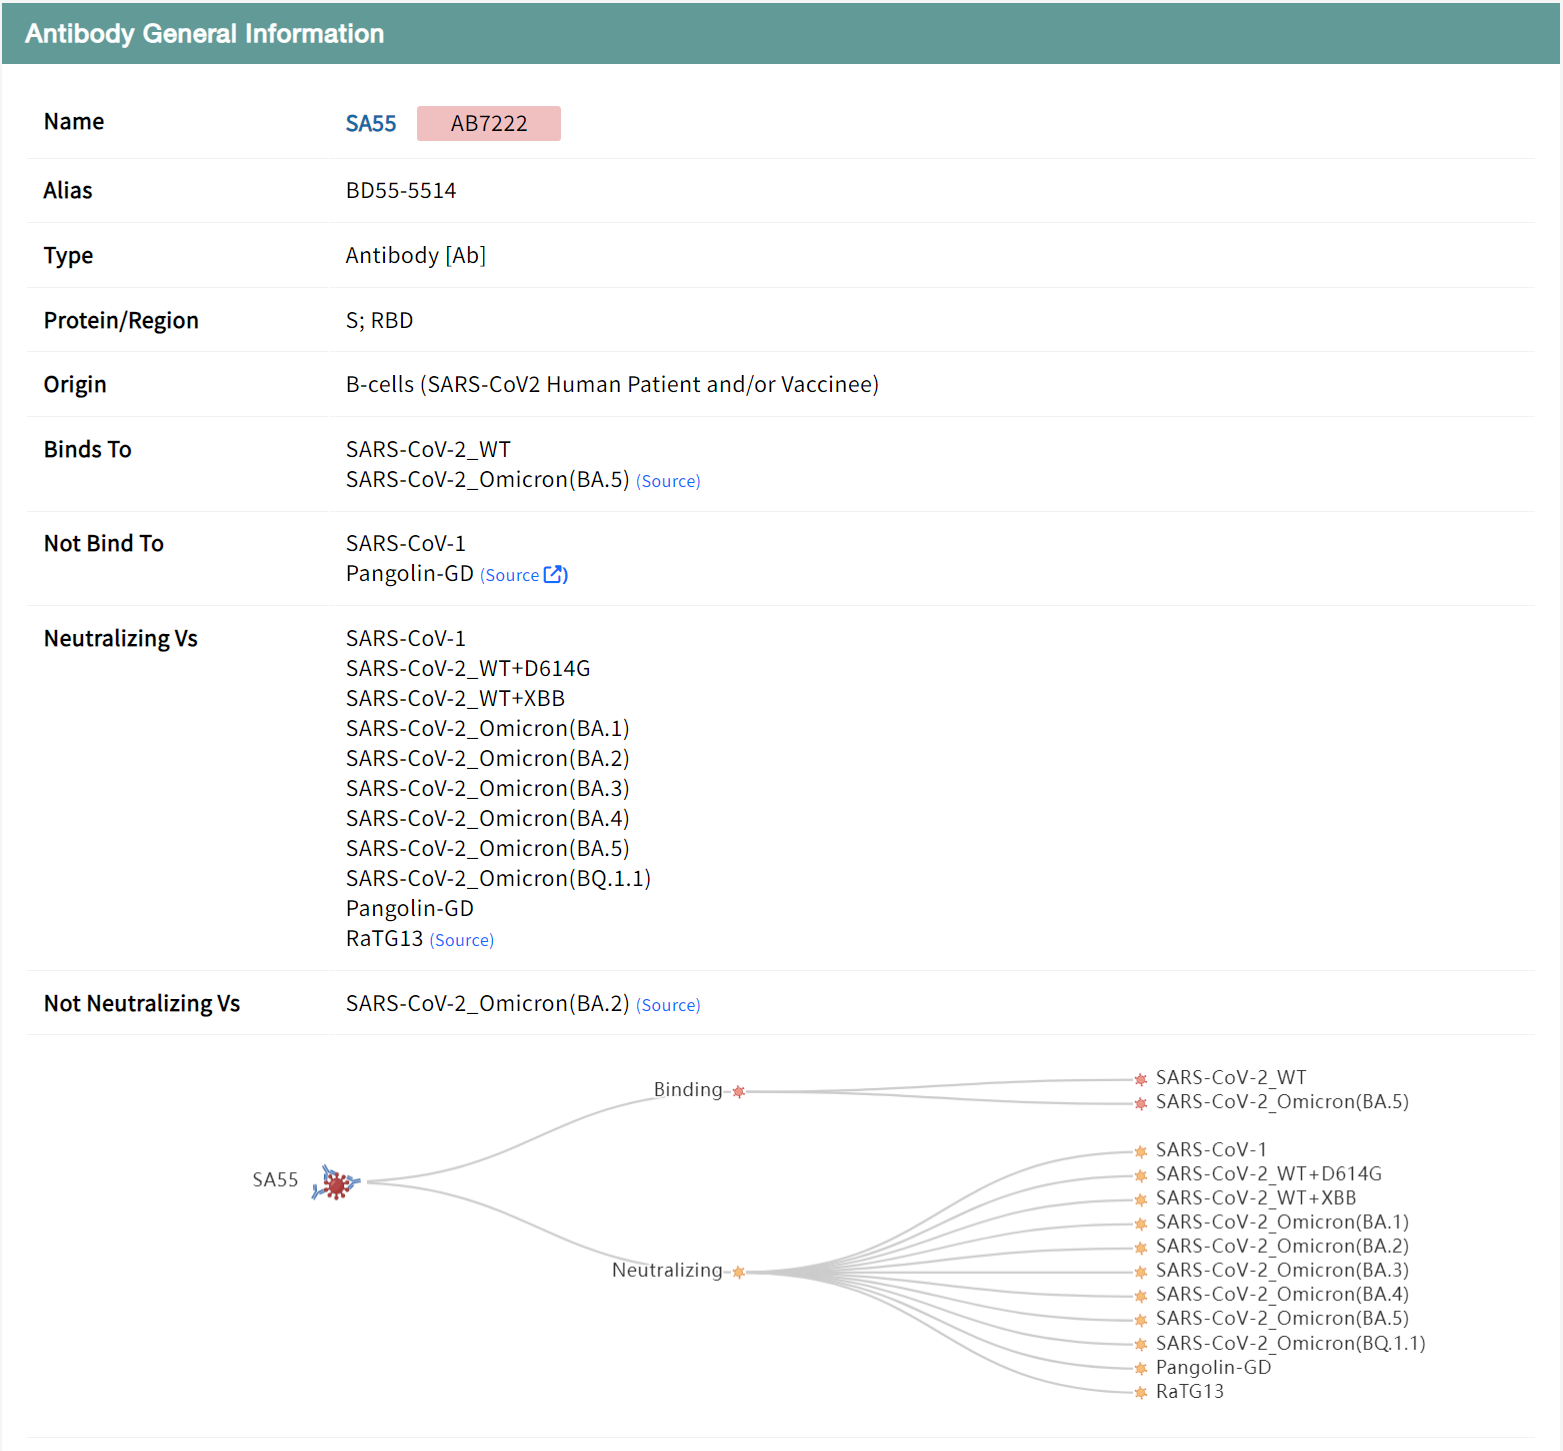
2.2. By clicking the antibody ID button, the detailed information page for antibody will be displayed.
Take the SA55 antibody as an example, whcih is undergoing clinical trials, can effectively neutralize a variety of SARS-CoV-2 variants, including BQ.1.1 and XBB. "Antibody General Information" section displays the general information of SA55 antibody including its Name, Type, Origin, as well as binding and neutralizing characteristics against various viral strains.
Users can browse the analyzed structure of SA55, which is displayed by clicking the green PDB button, and download the structure file and jump to external links by clicking the blue button. Structural analysis of antibody-antigen binding sites can reveal intermolecular interactions and provide guidance for antibody design and optimization. Based on the complex structure, the table below lists the binding residues at the antigen-antibody contact interface, annotating mutations and key functional sites within the antibody binding region, including ACE2 binding sites, mAb resistance sites and conserved sites, with detailed information displayed on mouseover.

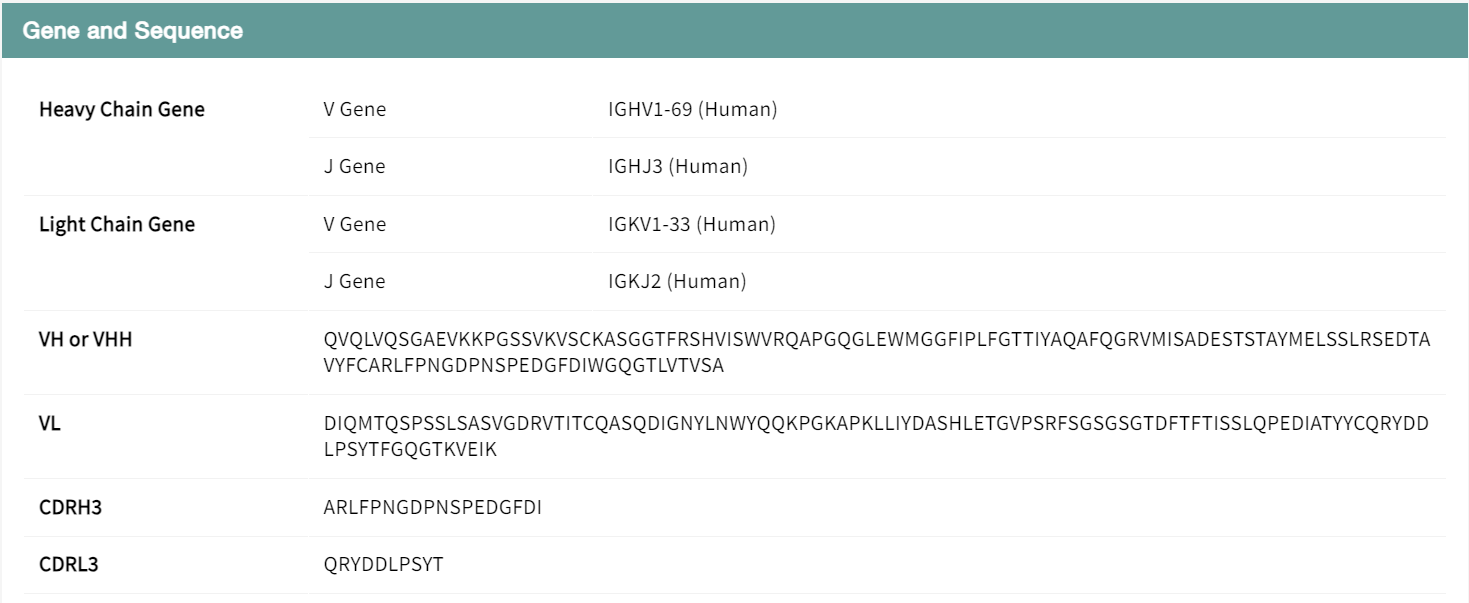
Users can view experimental data on the binding affinity and neutralizing activity of the antibody against viral strains and mutant combinations in a table to determine the effectiveness of the antibody. The data is presented in a tabular format to facilitate screening of records of interest, such as a search for BA.2. The results show that the neutralizing activity of antibody SA55 against the BA.2 variant is reduced by an additional mutation in V503, while mutations at other sites have little effect. Combined with structural analysis, 503 is a key binding site for the spike protein to the heavy chain of the antibody, and mutation of this site affects the activity of the antibody. the V503D mutation results in a complete loss of antibody activity, which may be due to the effects of charge characterization and spatial hindrance. The details page also includes information on the gene encoding the antibody, the sequence and the literature source.

3.1. Browse SARS-CoV-2 variants in the "Virological Characteristics" panel
SARS-CoV-2 genomic variants may lead to increased transmissibility and infectivity, evasion of immune responses, and reduced efficacy of vaccines and therapies. In the "Virological Characteristics" section of Variant page, users can monitor the mutations and virologic properties of emerging SARS-CoV-2 variants. The database provides virological characterization of SARS-CoV-2 variants, including the currently prevalent Omicron subvariants and other variants such as B.1.1.7 (Alpha), B.1.351 (Beta), P.1 (Gamma), and B.1.617.2 (Delta).
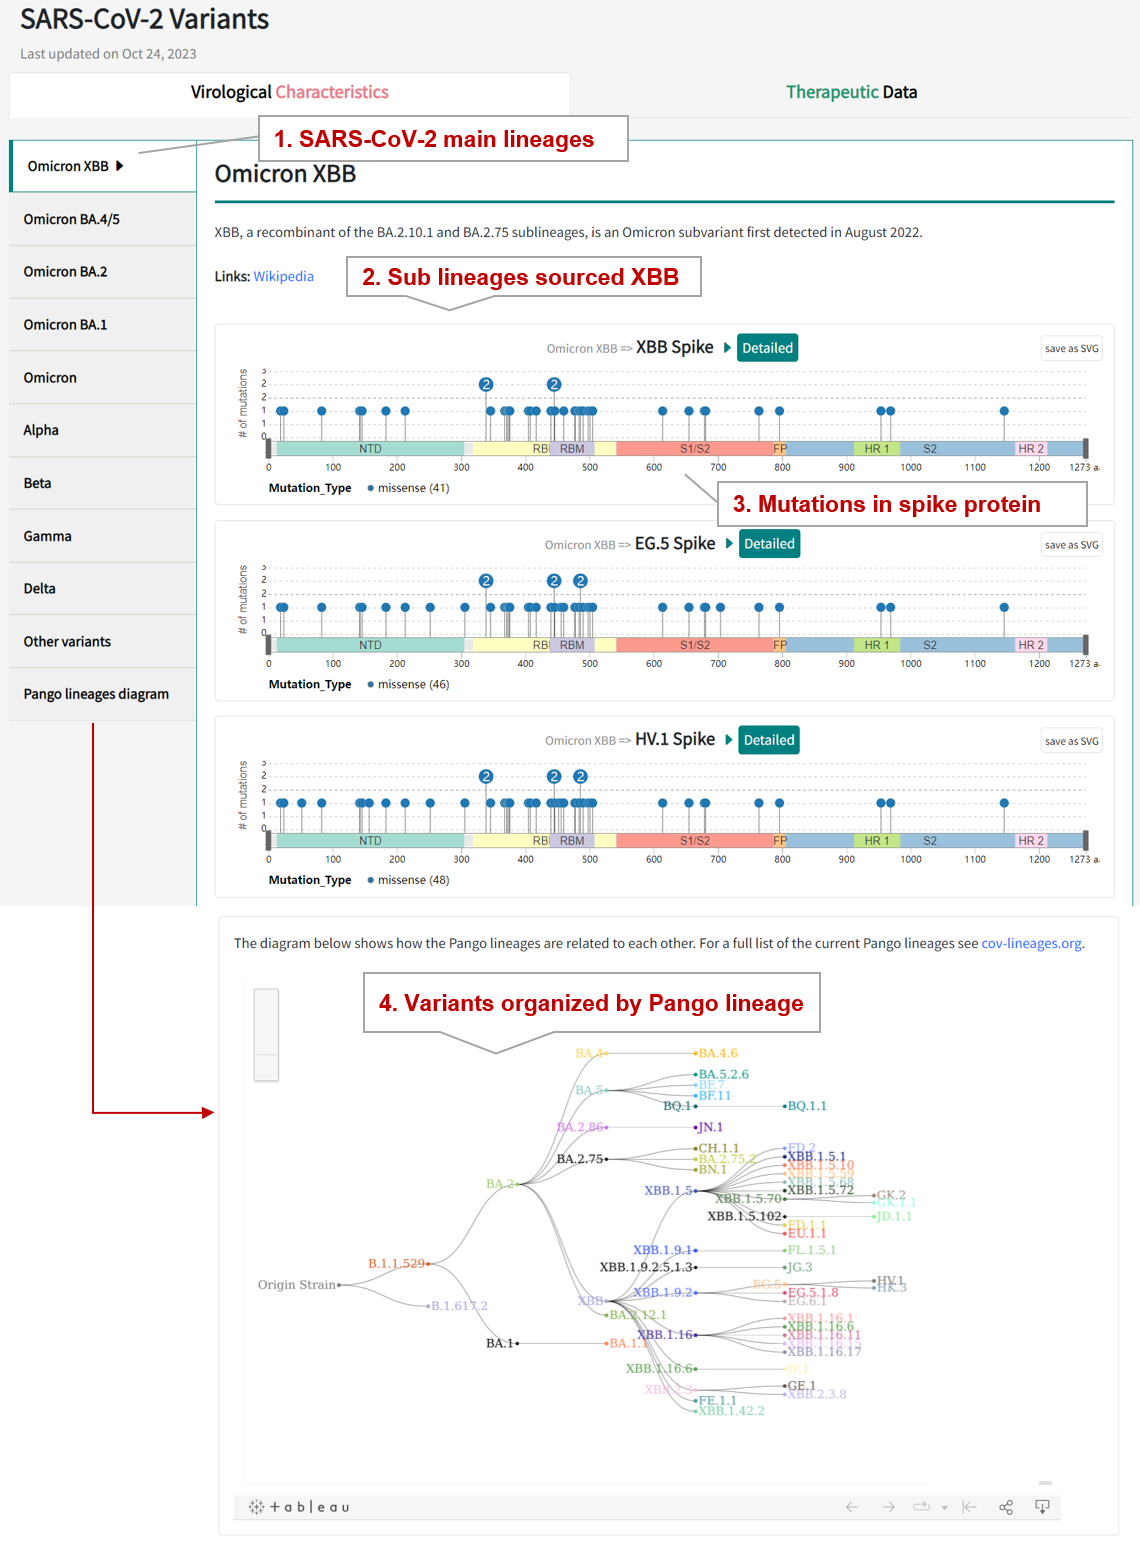
3.2. By clicking the "Detailed" button, the detailed information page for variant will be displayed.
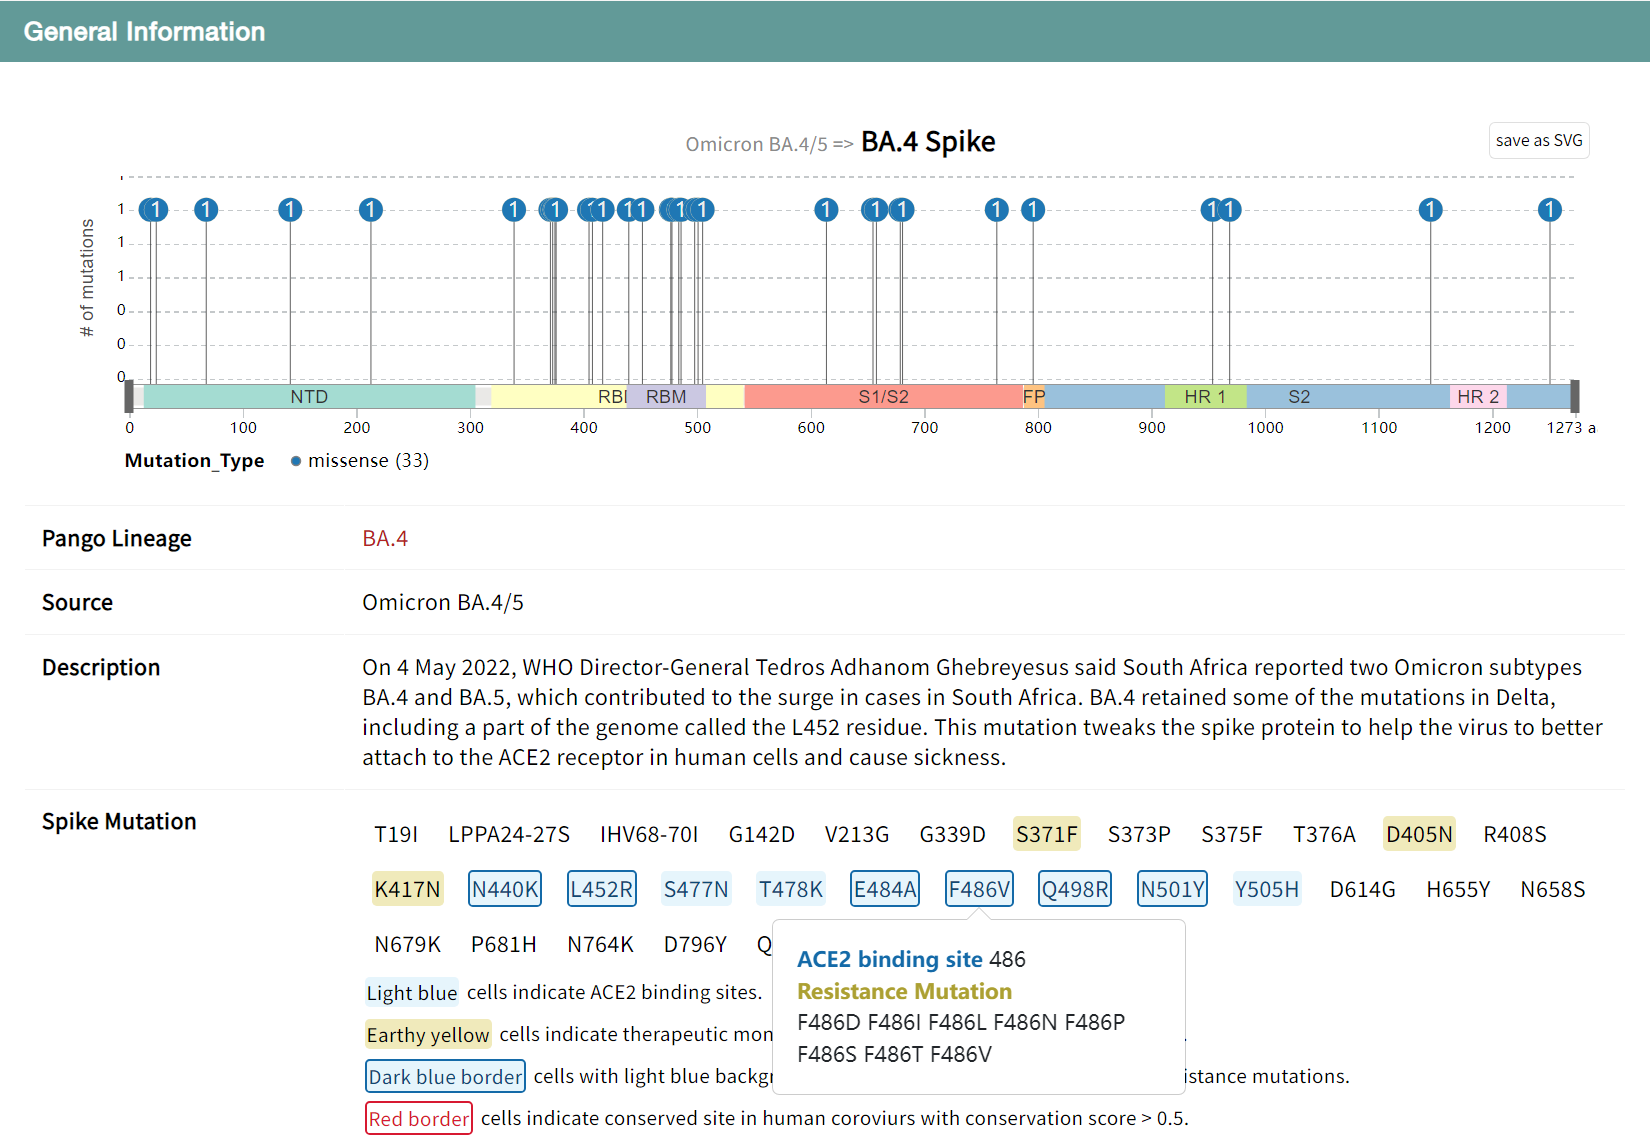
For example, if you want to know the detail information of BA.4 variant, click the "Detailed" button links to the detailed variant information page.
"Variant General Information" section displays the general information of BA.4 variant including its Pango lineage, Source, Description, and Spike mutation. Users can click on the lollipop diagram to illustrate and compare mutations on variant sipke proteins. Hover over the sipke mutation to view functional annotations for the site, including receptor binding sites, mAb resistance sites, and conservation sites.
For the RBD structural domains, the results of DMS experiments to characterize the effect of mutations on protein expression and receptor binding are presented in the table.

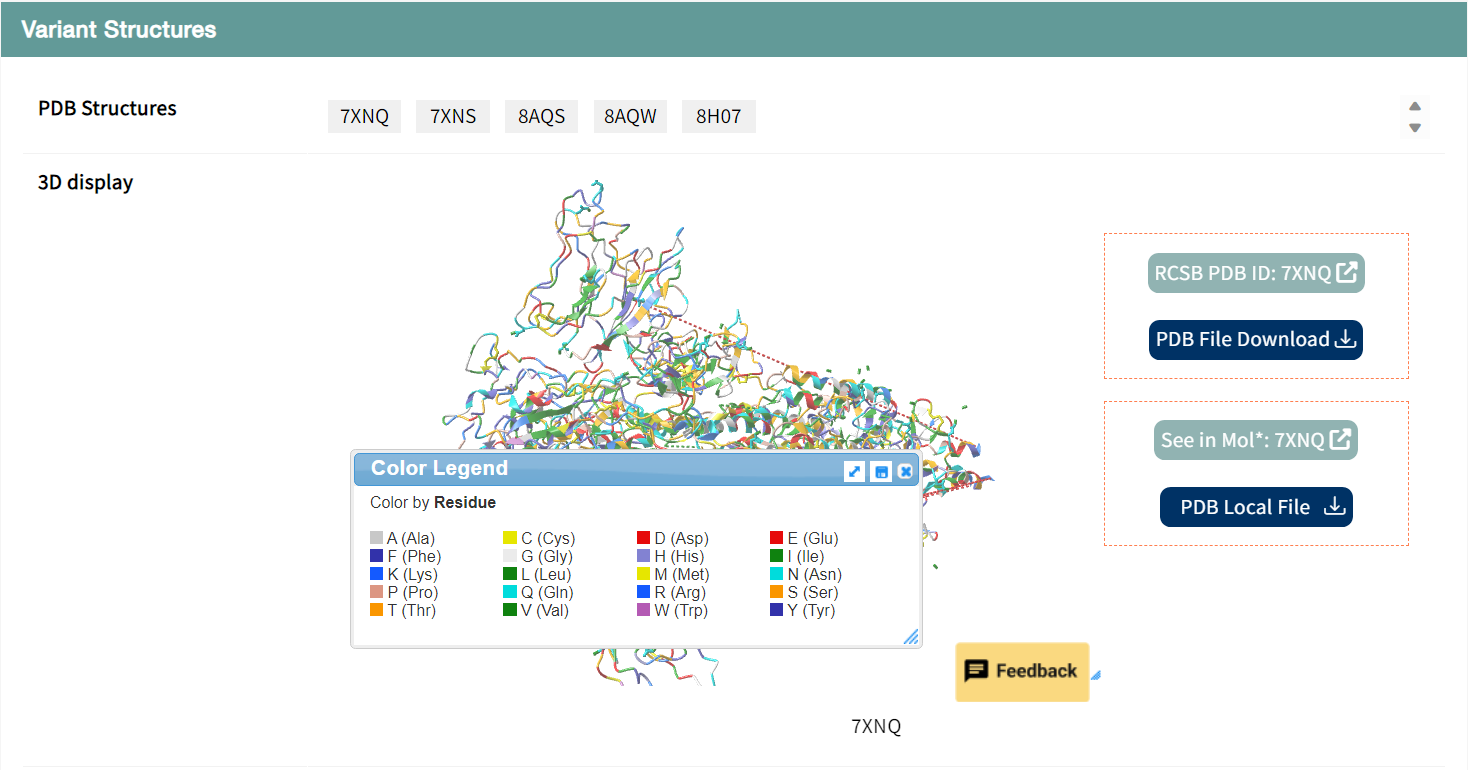
Users can browse the analyzed structure of BA.4 variant, which is displayed by clicking the green PDB button, and download the structure file and jump to external links by clicking the blue button.
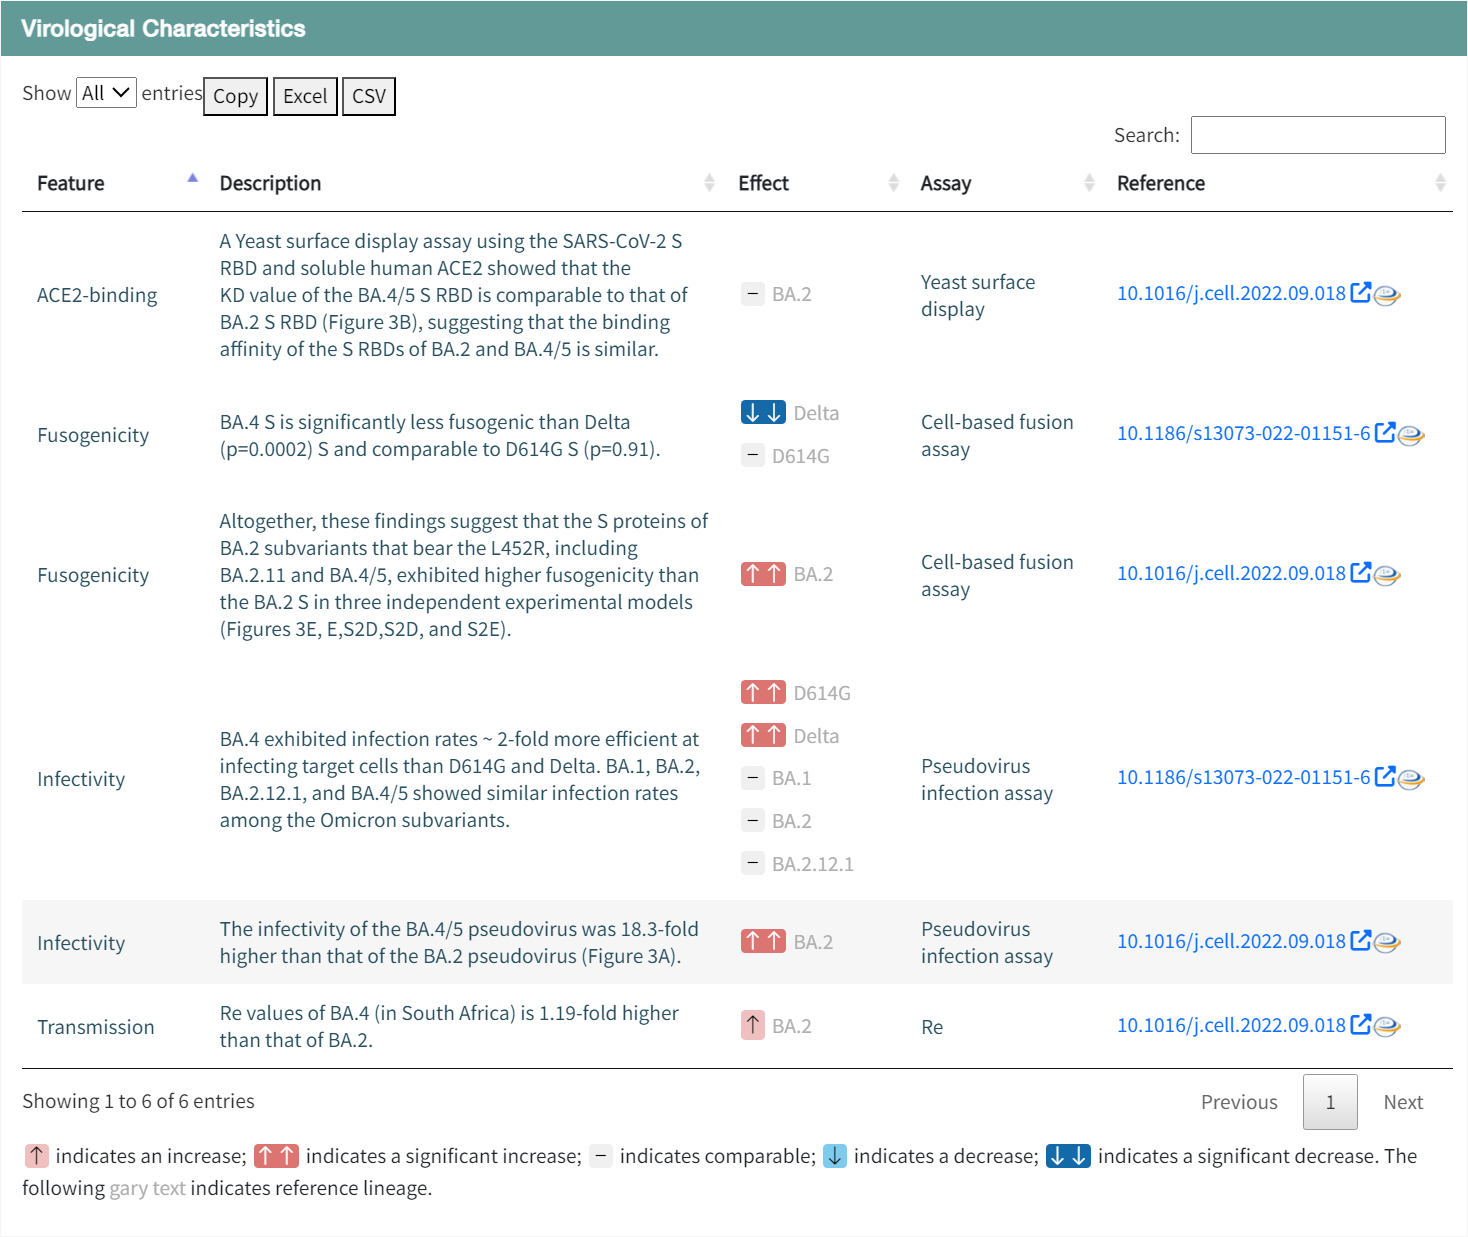
For the emerging SARS-CoV-2 variants, careful and rapid assessment of their virologic characteristics and drug resistance is needed. In the Virological Characteristics section, users can view information on changes in transmissibility, ACE2 binding affinity, fusogenicity, and infectivity of the variant compared to other variants. It also includes experimental methods, description of results, and data sources.
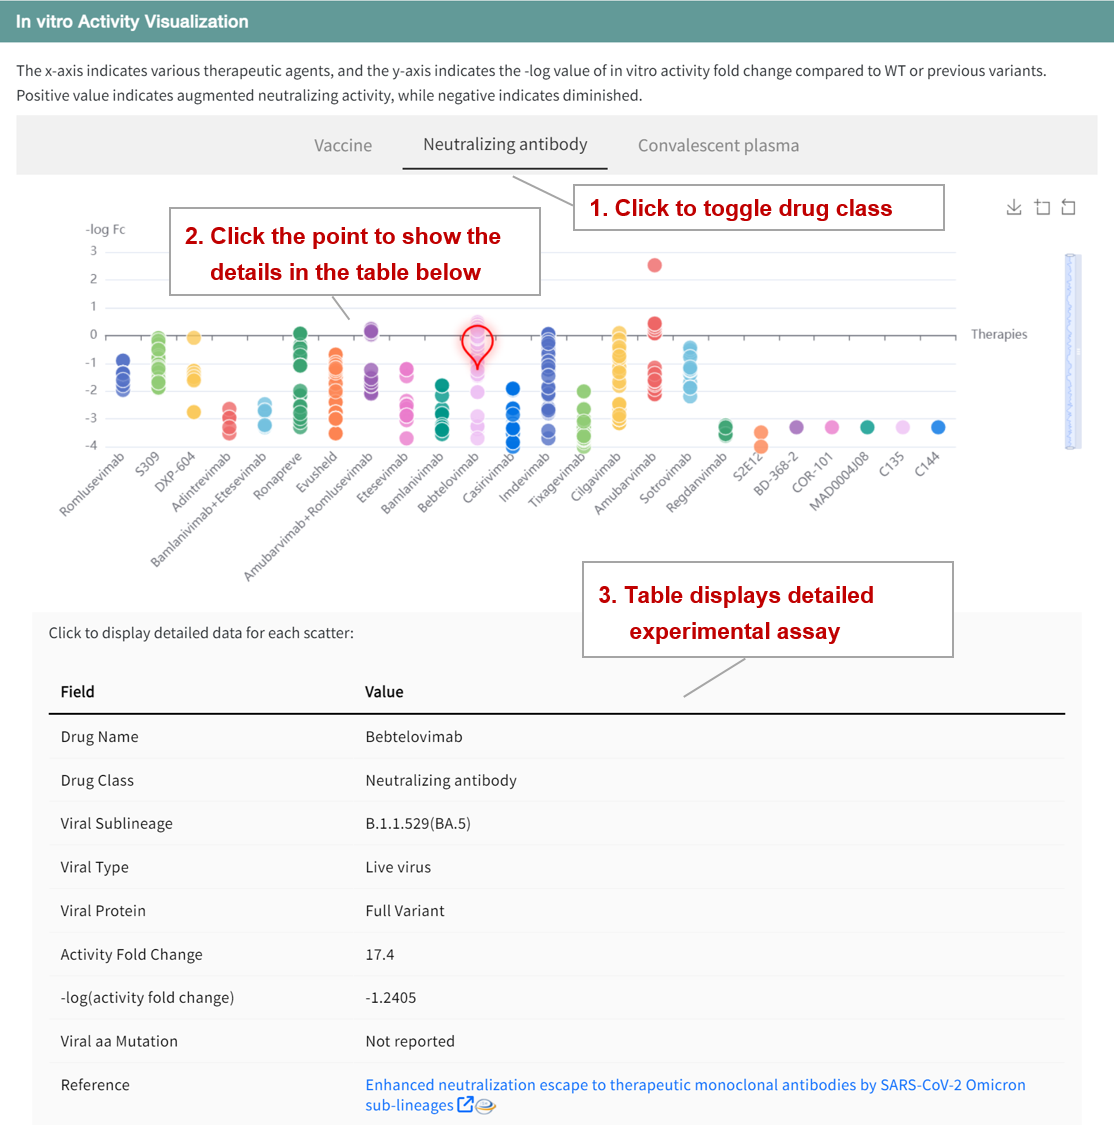
In addition, a scatter plot was constructed to illustrate the sensitivity of the variants to various therapeutic agents. x-axis represents the therapeutic agent, and y-axis represents the negative logarithm of the fold change in activity (-log(Fc)) in vitro compared to WT or previous variants. Positive values indicate increased neutralizing activity and negative values indicate decreased neutralizing activity. Users can toggle the buttons above the graph to explore the assessment of effectiveness for different drug classes. Clicking on a point in the scatterplot displays detailed information and data sources in the table below.
3.3. Browse SARS-CoV-2 variants in the "Virological Characteristics" panel
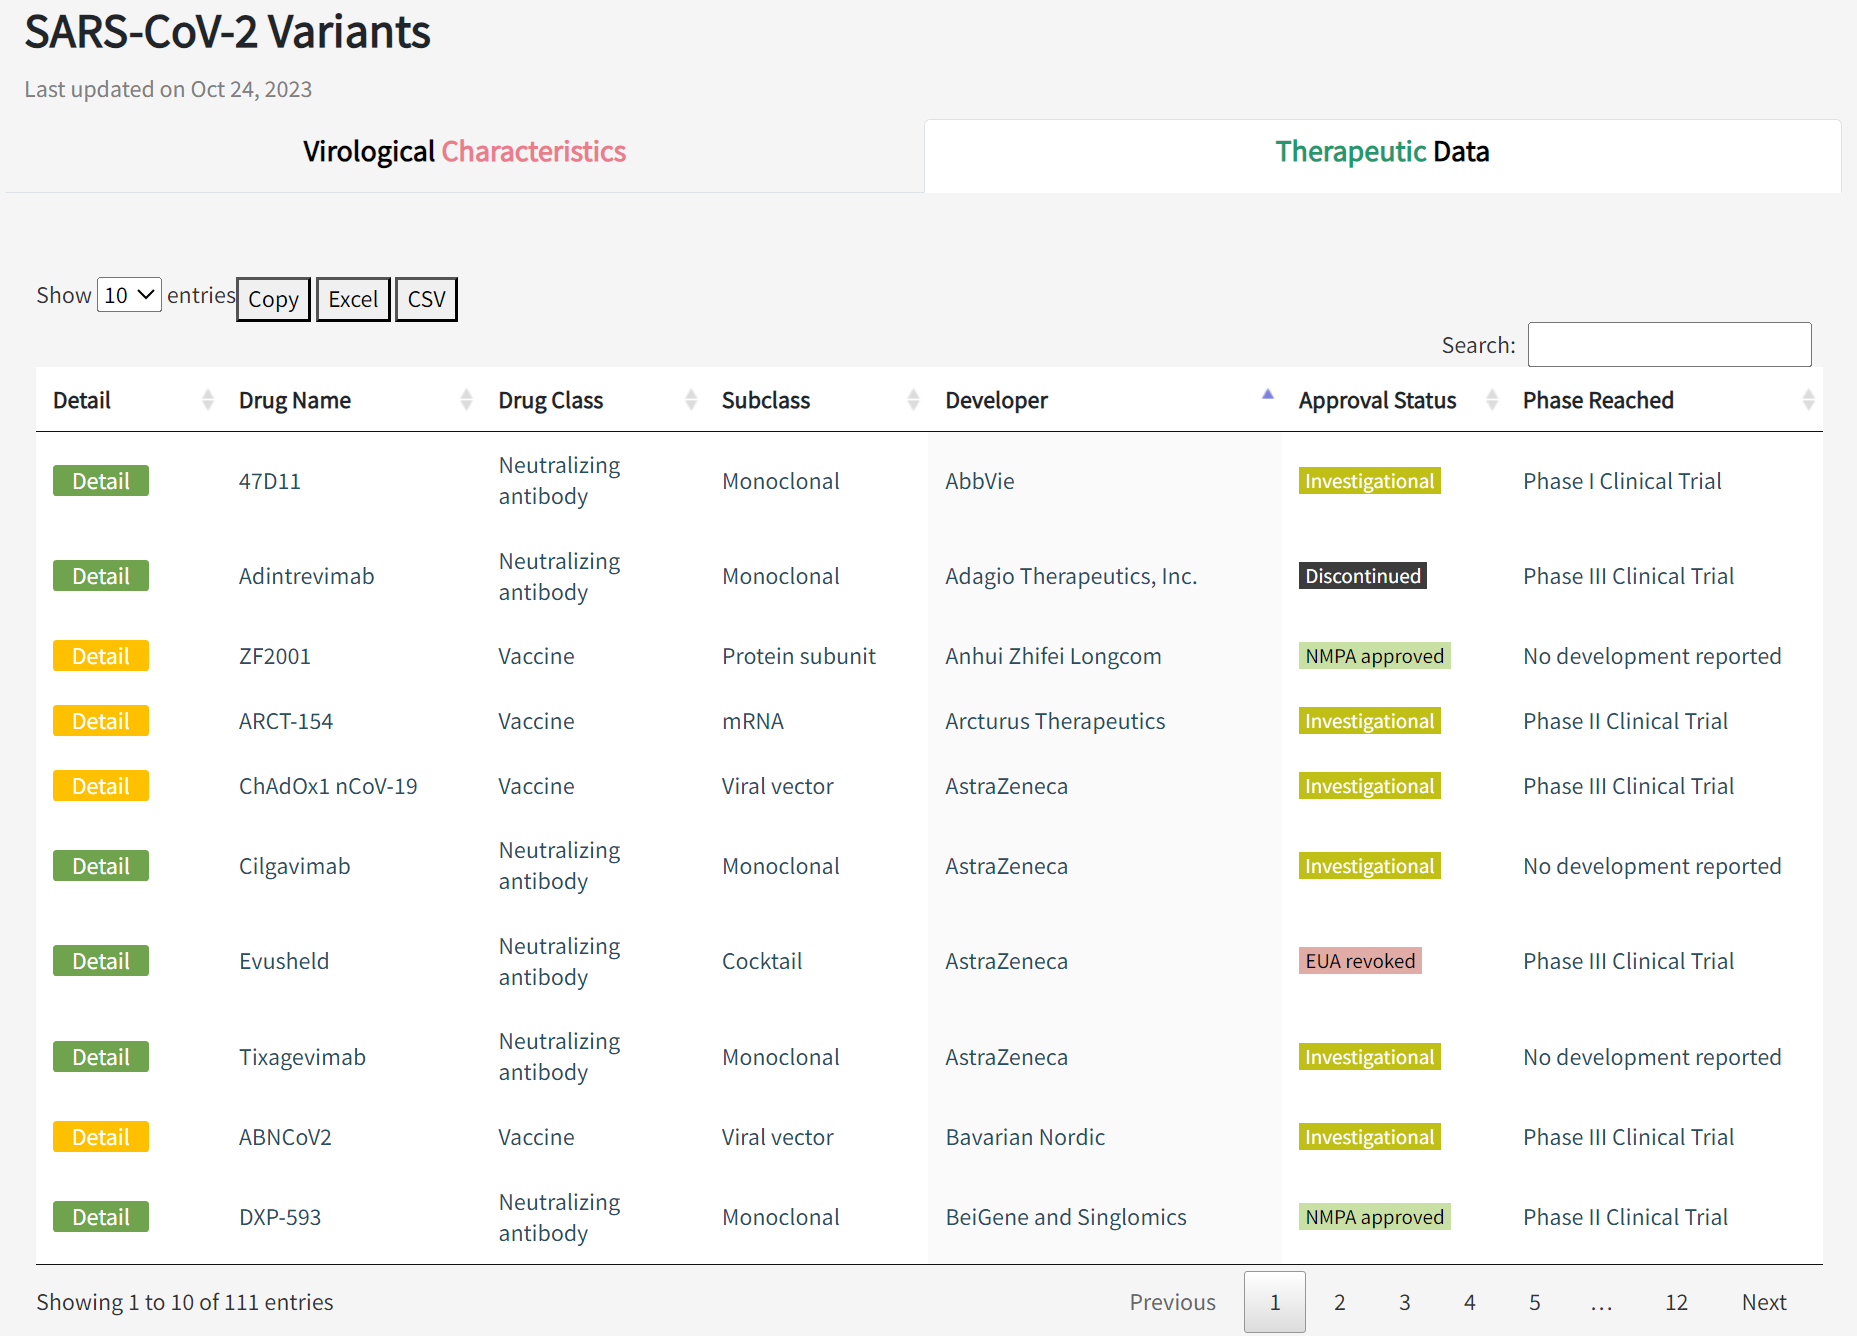
In the "Therapeutic Data" panel of the Variants page, the table shows advanced therapies involving 55 vaccines, 34 neutralizing antibodies, and 22 convalescent plasma samples, including details of the developer, approval status, and clinical stage. Click on the "Details" button to go to the details page. In addition to the basic information, there are similar scatter plots that provide a quick assessment of the neutralizing activity of the therapeutic agent against the various variants.
4.1. A brief introduction to COVEP
COVEP is an integration of existing recognized B-cell and T-cell epitope prediction tools with a user-friendly application and web interface. COVEP provides users with a comprehensive set of resources: Online Webserver, Docker Image, Source Code. A detailed description of the prediction tools in COVEP can be found on the About page and in the METHOD section of our paper. For the usage of docker images and github source code see their REMDME documentation.
Here we describe how to use the online webserver to perform epitope prediction and view the prediction results.
4.2. How to use COVEP to predict T-cell epitopes?
The steps for T-cell epitope prediction are as follows:
(1) Enter a name for the prediction task. This is optional and will have no effect on the prediction process. It is recommended to enter the task name.
(2) Upload the protein sequence file in fasta format. The file format should contain the sequence name at the beginning of > and the protein sequence on the following line. Refer to Input_Demo.txt for the file format.
(3) Upload the HLA allele file in csv format. The file format requires the column names to be HLA1 and HLA2. If only MHC class I T-cell epitopes are to be predicted, only the HLAI column can be included, and the same applies to MHC class II. Refer to HLA_Demo for the file format.The uploaded HLA alleles must be supported by the prediction tool. Download the Support_HLA_and_Tools_Threshold.xlsx file to view the HLA alleles supported by the prediction.
(4) Enter the email to receive the prediction results. If the user enters an e-mail address, the results will be sent to the user's mailbox when the prediction is complete. This is optional and will have no effect on the prediction process. However, it is recommended to use this option when submitting larger prediction tasks (eg., total number of amino acids in the input file more than 300) because the prediction waiting time will be longer.
(5) Select the prediction method. For MHC class I T-cell epitope prediction, you can choose MHCflurry2.0, NetMHCpan-4.1 and DeepHLApan, of which MHCflurry2.0 is the fastest, followed by NetMHCpan-4.1 and DeepHLApan is the slowest. If DeepHLApan is selected, the prediction time may be longer, depending on the task volume. For MHC class II T cell epitope prediction, NetMHCIIpan-4.0 and Mixmhc2pred can be chosen, both of which are faster.
(6) Waiting for prediction. After clicking the Prediction button to submit the task, the page will go to Waiting, at this time the task will run in the back-end. If the user leaves the page during the waiting process, the prediction results will be lost, so we recommend the user to fill in the email and the results will be sent to the user's mailbox after the prediction is completed.

(7) How the prediction is done? The MHC class I binding prediction tools are designed to predict the binding of a peptide with 8-14mer length to a specific HLA class I allele. All input protein sequences are cleaved for all possible 8-14mer peptides, which are then combined with all input HLA alleles to form peptide and HLA pairs (pMHCs), and all pMHCs are then being predicted. For the MHC class II binding prediction tools, the peptide length is 12-25mer.
MHC Class I Binding Prediction:
Tools designed for 8-14mer peptides binding to specific HLA class I alleles.
Input protein sequences are cleaved into all possible 8-14mer peptides.
Peptides are combined with all input HLA alleles to form peptide and HLA pairs (pMHCs).
Prediction is performed for all pMHCs to assess binding affinity.
MHC Class I Binding Prediction:
Tools designed for 12-25mer peptides binding to specific HLA class II alleles. Others as above.
(8) How to view the prediction results?
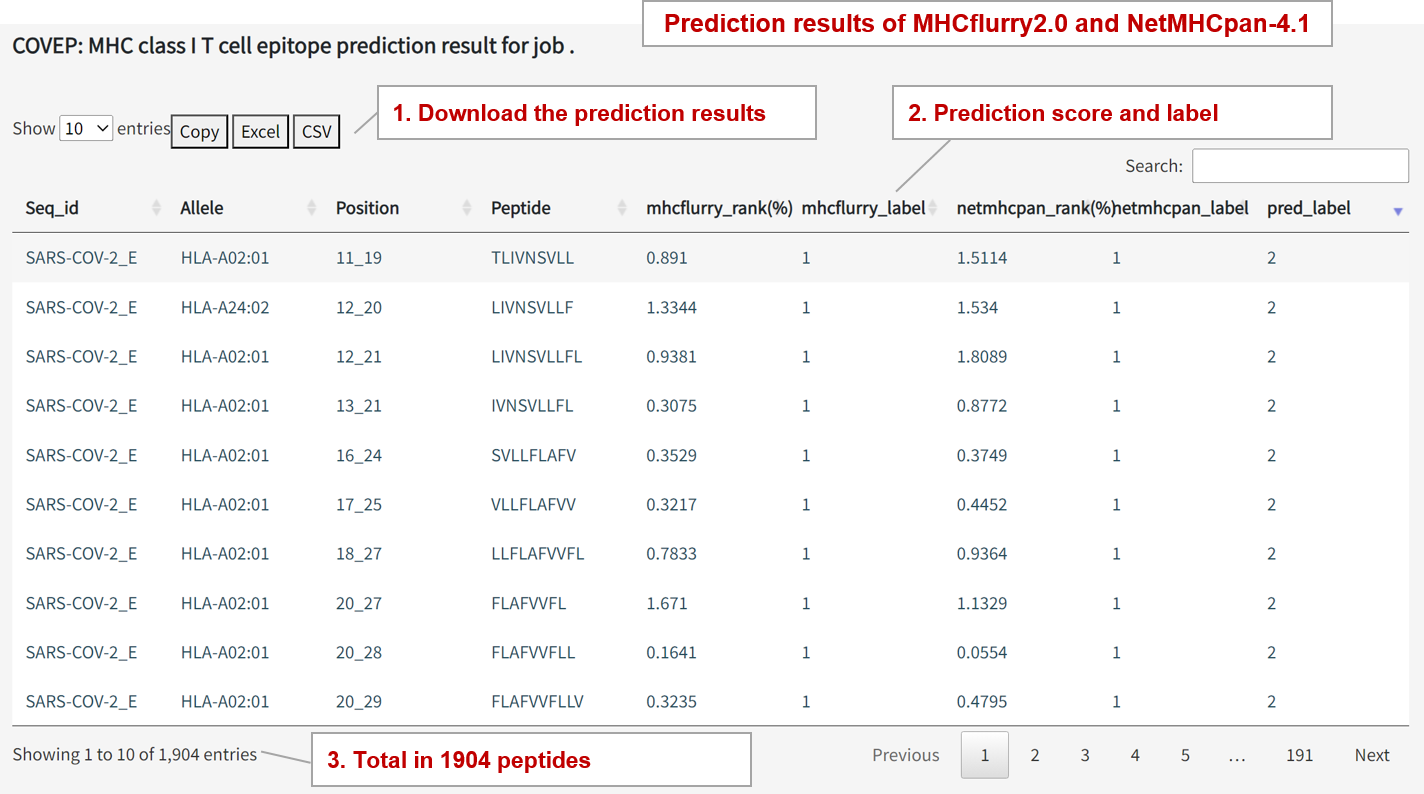
MHC Class I Binding Prediction Results
MHCflurry Output: mhcflurry_rank(%), mhcflurry_label
'mhcflurry_rank(%)': Represents the peptide's rank among all peptides. Lower number indicates higher rank, and rank < 2% is positive. 'mhcflurry_label': 1 for positive and 0 for negative.
NetMHCpan Output: netmhcpan_rank(%), netmhcpan_label
'netmhcpan_rank(%)': Represents the peptide's rank among all peptides, and rank < 2% is positive. 'netmhcpan_label': 1 for positive and 0 for negative.
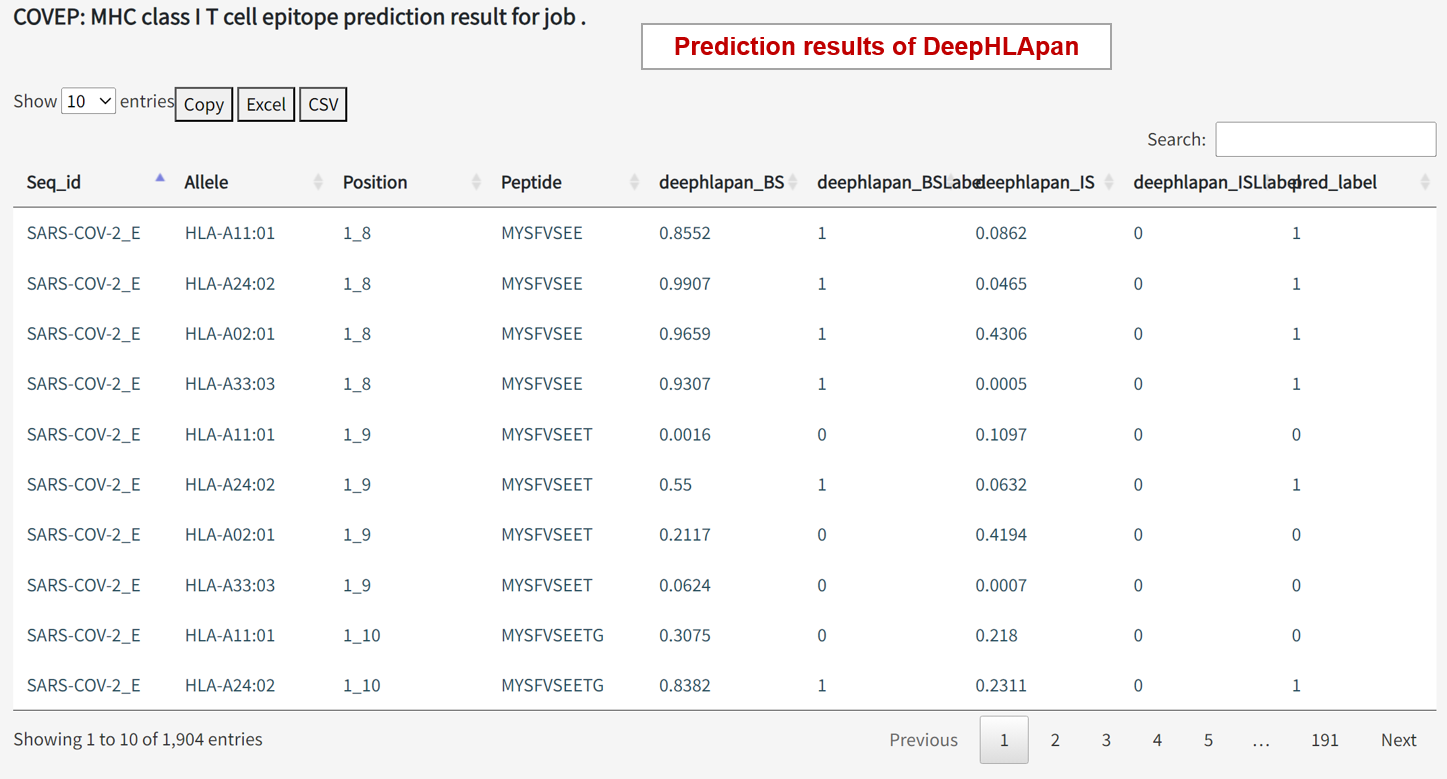
DeepHLApan Outputs: deephlapan_BS, deephlapan_BSLabel, deephlapan_IS, and deephlapan_ISLabel
'deephlapan_BS' and 'deephlapan_IS': Score range from 0 to 1, where larger scores indicate higher binding probability and immunogenic. Positive if > 0.5. 'deephlapan_BSLabel' and 'deephlapan_ISLabel': 1 for positive and 0 for negative.
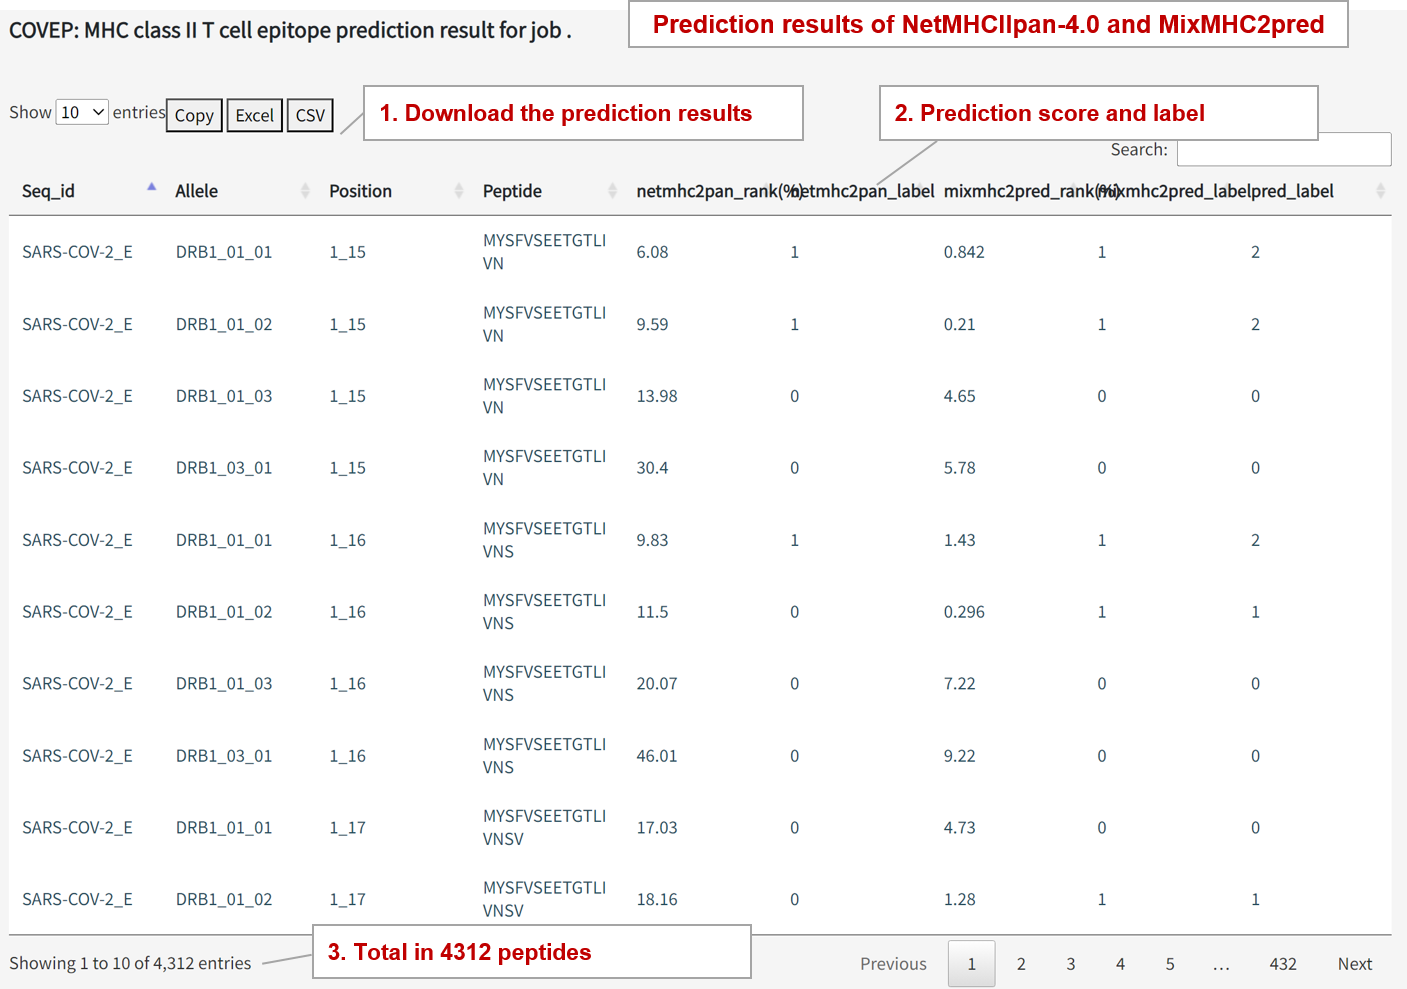
MHC Class II Binding Prediction Results
NetMHCIIpan Output: netmhcIIpan_rank(%)
Represents the peptide's rank among all peptides, and rank < 10% is considered positive.
MixMHC2pred Output: micmhc2pred_rank(%)
Represents the peptide's rank among all peptides, and rank < 2% is considered positive.
Download the Support_HLA_and_Tools_Threshold.xlsx file to access tool-specific thresholds for supported predictions. These scores and ranks assist in identifying potential immunogenic epitopes.
4.3. How to use COVEP to predict B-cell epitopes?
The seven tools used for B-cell epitope prediction are IEDB built-in tools available online at the IEDB Analysis Resource page, where each method can be selected for individual prediction. COVEP integrates these seven prediction tools, but due to network reasons, the prediction can only be done locally by downloading the docker image or the source code for now, and we optimize it subsequently. The seven prediction tools are:
More detailed information of these tools can be found on the About page.(1) BepiPred-1.0
(2) BepiPred-2.0
(3) Chou, and Fasman beta turn prediction
(4) Emini surface accessibility scale
(5) Karplus and Schulz flexibility scale
(6) Kolaskar and Tongaonkar antigenicity scale
(7) Parker hydrophilicity prediction